
Lithuania’s economic development and outlook
15 September 2026
Economic activity in Lithuania is expanding at a solid pace; however, developments vary considerably across sectors. Manufacturing output expanded notably in the first half of 2026. This was likely supported by stronger global international trade and efforts to boost production amid concerns that the ongoing conflict in the Middle East could lead to higher prices for a range of commodities. Among the major industrial branches, the strongest growth was recorded in the manufacture of rubber and plastic products, as well as wood products and furniture. Notably, manufacturing output as a whole has continued to grow at, or even above, its long-term rate. Construction activity has also increased significantly. European Union (EU) co-financed projects have contributed to a marked expansion of civil engineering activity. Residential and non-residential construction also increased. Retail trade activity has likewise picked up in recent months. Following the introduction of the option for households to withdraw and use funds accumulated in the second-pillar pension funds, retail trade has been growing above its previous trend since March this year. The strongest increase was recorded in sales of non-food products, including audio, video, information and communication equipment, clothing and footwear, and furniture. Retail trade in food, and food and beverage service activities were affected to a much lesser extent. By contrast, growth in some business services slowed. This was particularly evident in the information and communication, and professional, scientific and technical services sectors.
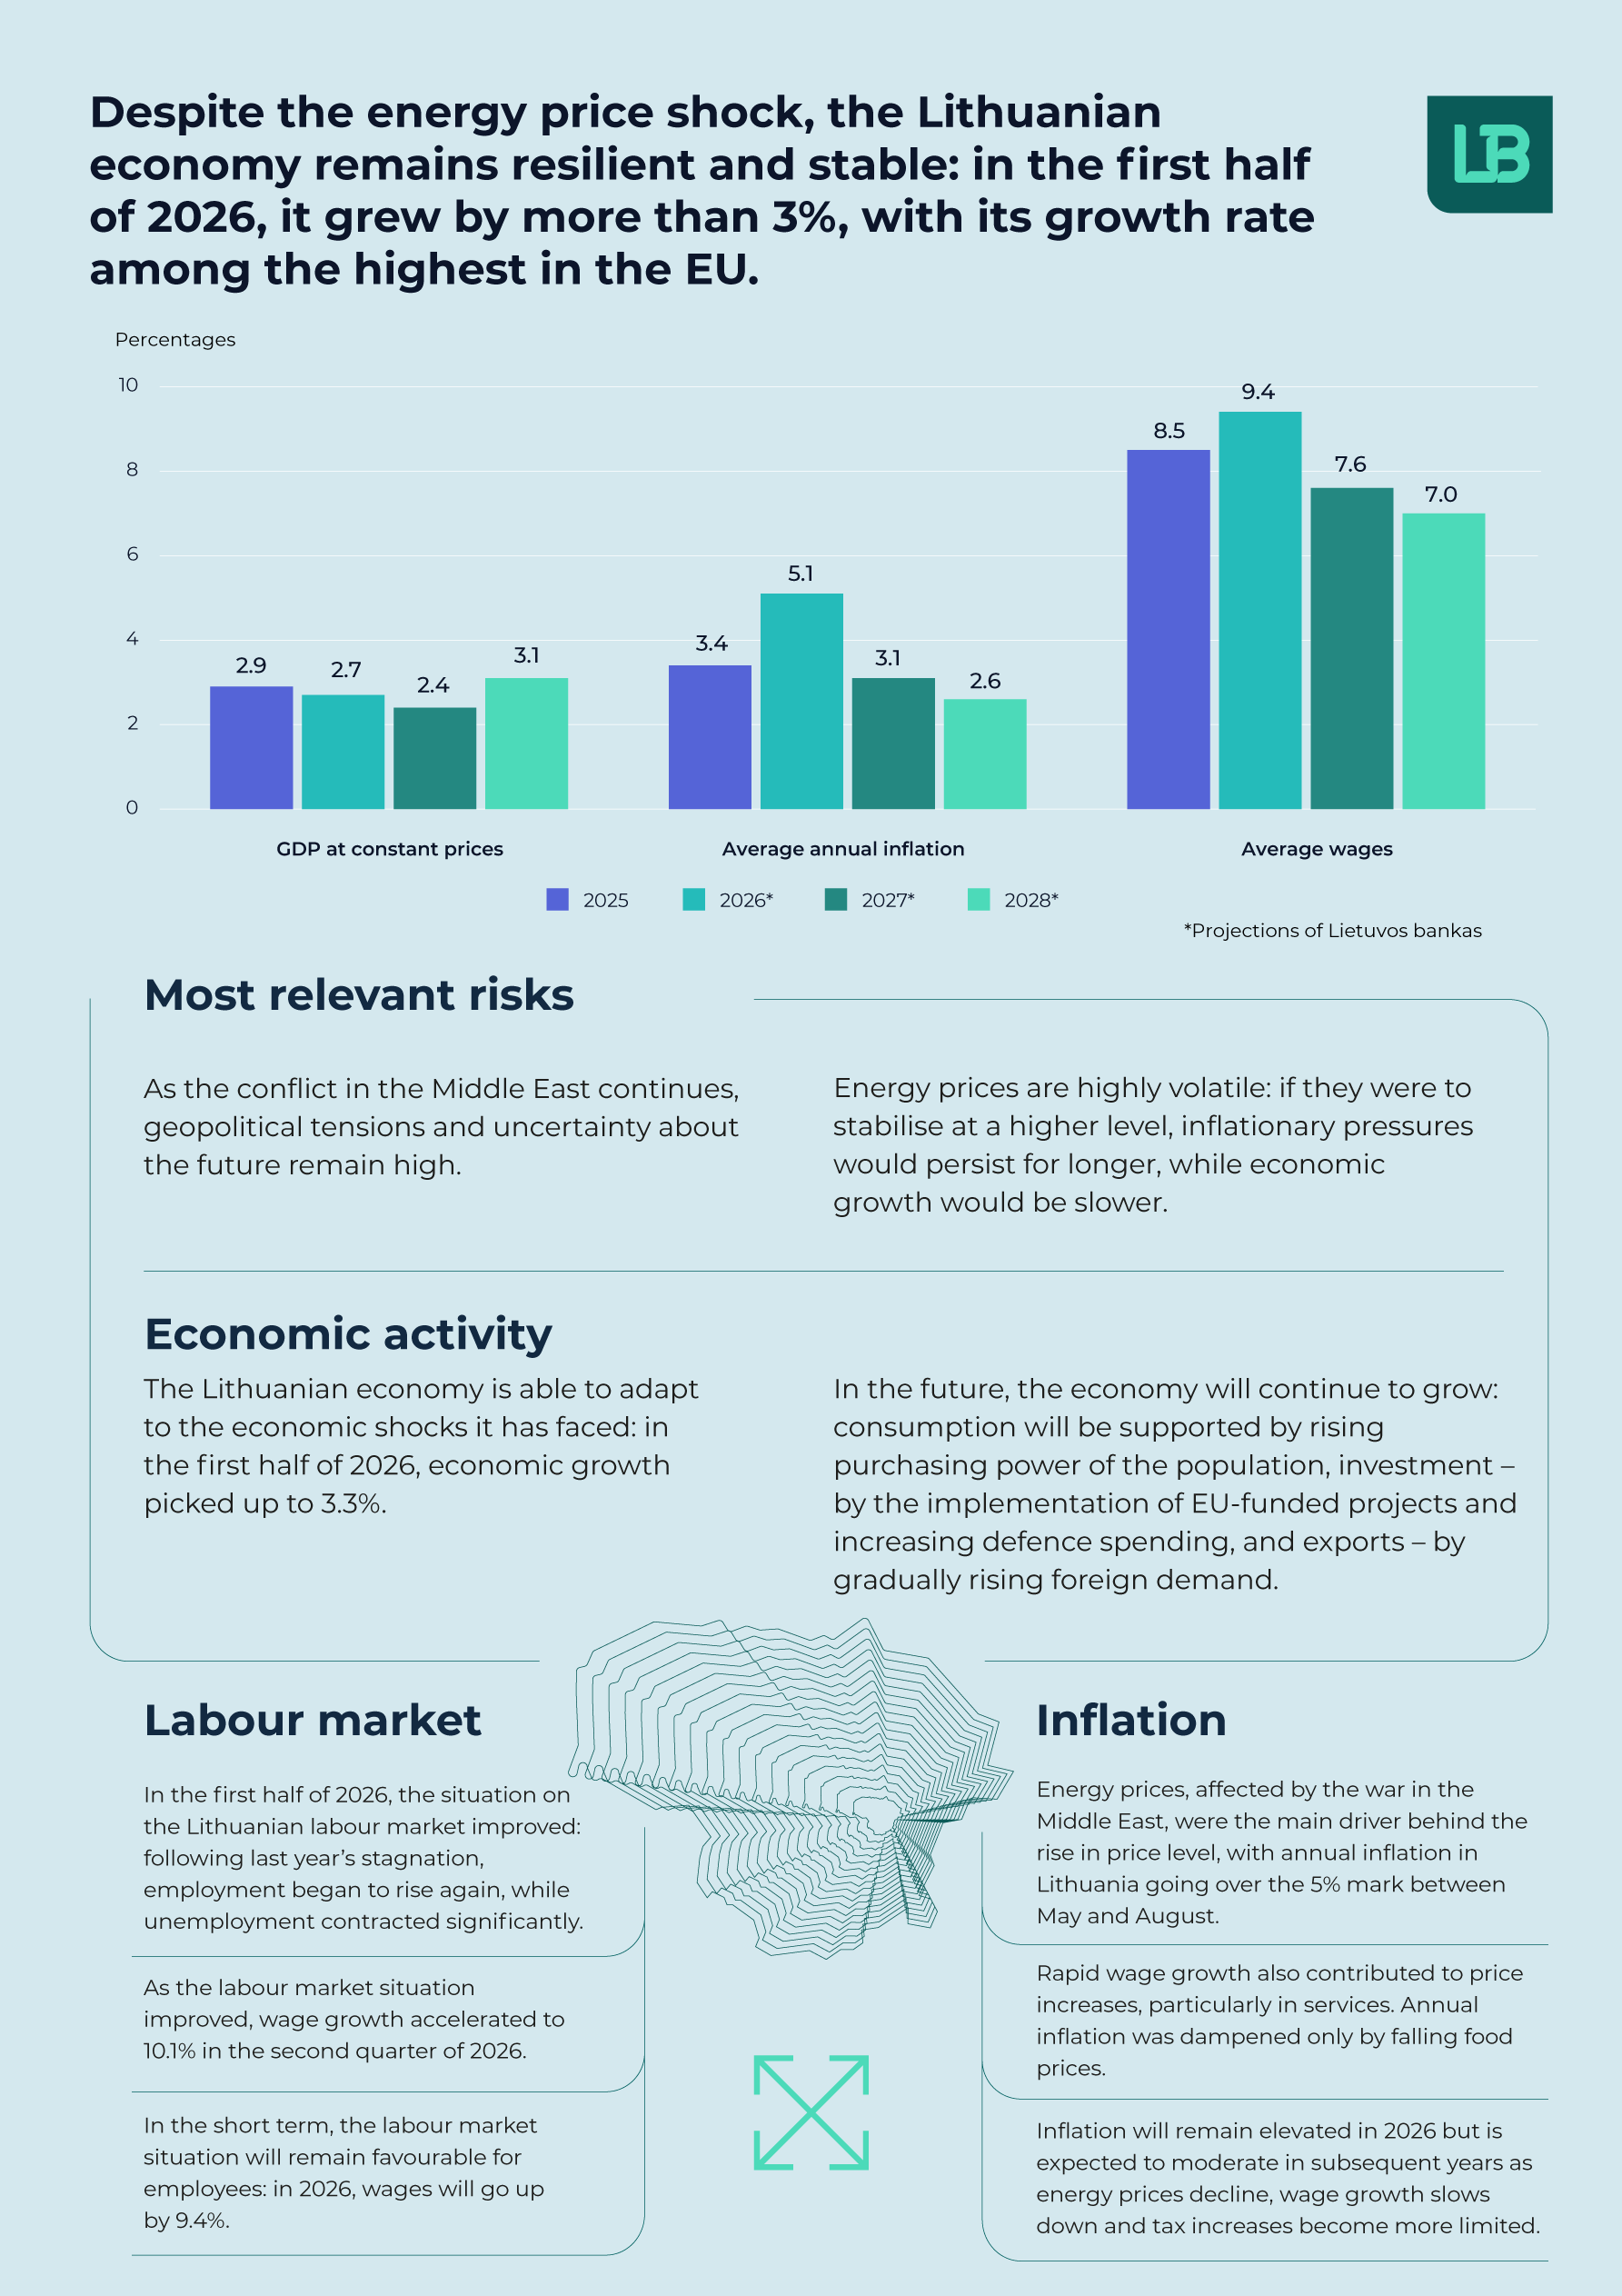
The economy is expected to continue growing gradually, albeit with potentially significant short-term fluctuations. Rising household income, the absorption of EU funds and strengthening external demand are expected to support economic activity in the coming quarters. This will be further supported by renewed improvement in consumer sentiment and by overall confidence across economic sectors remaining at a relatively favourable level, close to its long-term average. However, unlike in recent months, a significant additional boost to private consumption is unlikely, as households intending to spend their withdrawals from the second-pillar pension funds have probably already used a substantial share of them. The use of those funds in the future cannot be ruled out; however, they are unlikely to provide a significant additional support to domestic demand in the near term. Owing to base effect, the impact may even turn negative in the second half of 2026 and in 2027. Households’ financial situation remains relatively strong; for a prolonged period of time, household income has exceeded expenditure, while the saving rate has stayed markedly elevated. As a result, withdrawals from the second-pillar pension funds have been used for consumption only to a limited extent, and less than previously expected. However, some of these funds may be spent later, as the impact of higher prices becomes more pronounced, for example in late autumn and winter, when households pay their heating bills. However, as noted above, this will not provide an additional boost to private consumption but will rather help cushion the impact of higher prices. Investment expenditure is also expected to remain volatile. As projects financed under the Recovery and Resilience Facility are brought to completion and defence expenditure increases, investment growth is expected to be relatively higher this year before moderating over the remainder of forecast horizon. External demand is expected to exert a stronger stabilising effect on the economy. Rising investment in artificial intelligence, higher defence spending across a number of countries and the gradual decline in energy commodity prices are expected to support a steady expansion of global international trade and, consequently, demand for Lithuanian exports throughout the forecast period. Real GDP is projected to increase by 2.7% this year. In 2027, as the positive impact of withdrawals from the second-pillar pension funds fades and an adverse base effect comes into play, real GDP growth is expected to moderate to 2.4%. In 2028, as the economy returns to a more typical growth trajectory, real GDP is projected to grow by 3.1%.
Inflation will remain elevated this year, but it is expected to moderate in the years ahead. Annual inflation is expected to rise further in the remaining months of this year, with average annual inflation projected to reach 5.1% this year. Energy is expected to be the main component driving inflation, in contrast to previous years. In the subsequent years, average annual inflation will decline, reaching 3.1% in 2027 and 2.6% in 2028, mainly due to falling energy prices, lower tax increases and slower growth of wages.
Outlook for Lithuania’s economy
|
September 2026 projectiona |
June 2026 projection |
|||||
|
2026b |
2027b |
2028b |
2026b |
2027b |
2028b |
|
|
Price and cost developments (%, annual percentage change) |
||||||
|
Average annual HICP inflatione |
5.1 |
3.1 |
2.6 |
5.1 |
3.0 |
2.6 |
|
GDP deflatorc |
5.0 |
3.3 |
3.1 |
4.2 |
3.1 |
3.0 |
|
Wages |
9.4 |
7.6 |
7.0 |
8.7 |
6.9 |
7.2 |
|
Import deflatorc |
5.9 |
3.6 |
1.3 |
7.5 |
2.4 |
1.3 |
|
Export deflatorc |
6.3 |
3.0 |
1.8 |
6.8 |
1.9 |
1.5 |
|
Economic activity (constant prices; %, annual percentage change) |
||||||
|
GDPc |
2.7 |
2.4 |
3.1 |
2.7 |
2.0 |
3.3 |
|
Private consumption expenditurec |
3.0 |
1.0 |
3.0 |
4.1 |
-0.2 |
4.6 |
|
General government consumption expenditurec |
0.4 |
0.4 |
0.4 |
0.2 |
0.4 |
0.4 |
|
Gross fixed capital formationc |
8.2 |
5.7 |
5.1 |
10.1 |
3.7 |
4.6 |
|
Exports of goods and servicesc |
4.8 |
3.6 |
3.6 |
0.4 |
3.6 |
3.7 |
|
Imports of goods and servicesc |
7.8 |
2.6 |
3.8 |
3.9 |
2.5 |
4.6 |
|
Labour market |
||||||
|
Unemployment rate (annual average as a percentage of labour force) |
6.7 |
6.6 |
6.6 |
6.8 |
6.7 |
6.6 |
|
Employment (%, annual percentage change)d |
0.1 |
-0.3 |
-0.3 |
0.3 |
-0.3 |
-0.2 |
|
External sector (%, percentage of GDP) |
||||||
|
Balance of goods and services |
2.3 |
2.5 |
2.7 |
1.0 |
1.5 |
1.0 |
|
Current account balance |
-1.0 |
-0.8 |
-0.7 |
-1.9 |
-1.6 |
-2.4 |
|
Current and capital account balance |
1.1 |
0.2 |
0.3 |
0.5 |
-0.5 |
-1.5 |
a The macroeconomic projections are based on external assumptions, constructed using information made available by 19 August 2026, and other data and information made available by 1 September 2026.
b Projection.
c Adjusted for seasonal and workday effects.
d National accounts data; the number of employed persons is defined based on the domestic concept.
e Harmonised Index of Consumer Prices.
1.International environment
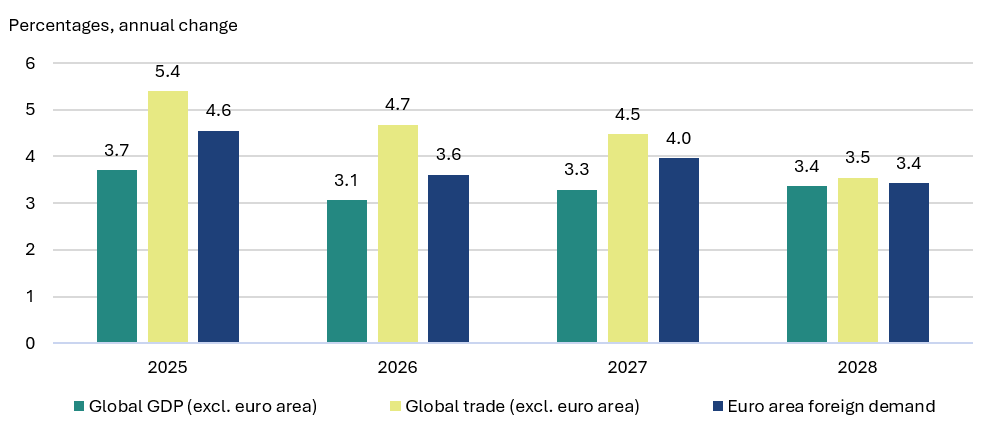
The growth of international trade and euro area foreign demand will slow slightly but will remain robust.
Chart 1. Growth of global trade, euro area foreign demand and global GDP
Source: ECB.
2.Real sector
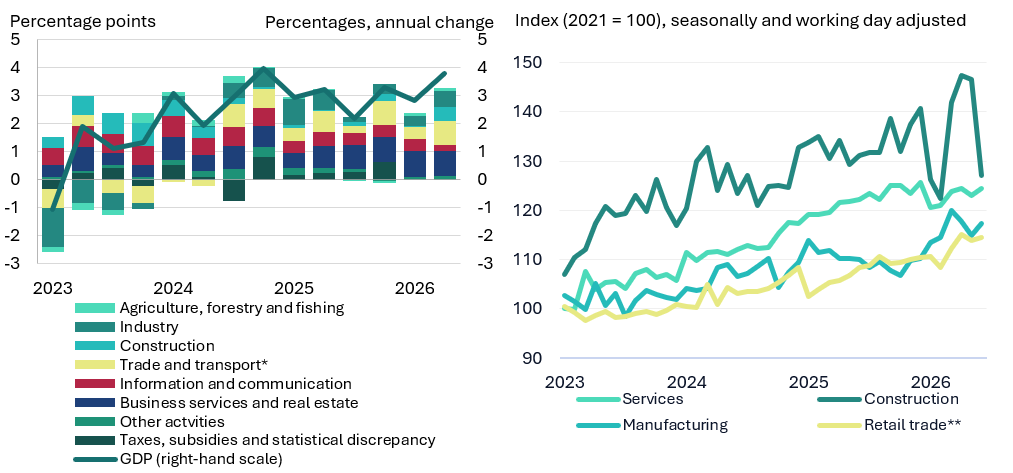
In the first half of 2026, economic growth in Lithuania was uneven: a slowdown was recorded in the first quarter, while the second quarter saw robust growth. The quarter-on quarter change was negative at -0.1% in the first quarter and -1.7% in the second quarter; annual growth stood at 2.8% and 3.8% respectively (see Chart 2). In the first half of 2026, annual GDP growth stood at 3.3%. The main contributors to growth in the first half of the year were trade, transport, accommodation and catering services, manufacturing and construction, with construction of civil engineering works growing particularly rapidly. Growth in the latter was likely driven by increased public sector investment in infrastructure, including defence infrastructure. Meanwhile, growth in the information and communications sector was more moderate. Quarter-on-quarter growth in this sector was negative in the first quarter, at -0.4%, and around -0.01% in the second quarter, although annual growth stood at 7.3% and 4% respectively. Business sentiment among firms in the services sector improved, with the current business landscape viewed more favourably and expectations regarding external demand improving.
Industrial output rose by 2.5% year-on-year in the first half of this year. Industrial output grew rapidly in the first quarter, by 6.9% quarter on quarter and 3.3% year on year, but in the second quarter, quarter-on-quarter growth turned slightly negative (-0.3%), although year-on-year growth remained robust at 5.2%. Among the industrial sectors, petroleum products contributed most to growth over the six months as their production rose by more than 13% in the first quarter but contracted slightly in the second quarter (-1.5%). The chemical industry grew by 7.4% in the first quarter but fell by 9.2% in the second quarter, with output returning to its previous level, or even falling slightly below it. This mainly reflected a decline in fertiliser production. Due to high gas prices and the cost of emission allowances, fertiliser production in Lithuania has been running below capacity for some time. The future performance of fertiliser producers will depend on gas and fertiliser prices, which will be strongly affected by the situation in the Strait of Hormuz. Exports of goods grew in both quarters by 1.4 and 0.6% respectively. As regards the short-term outlook, confidence of manufacturing firms declined in the second quarter, with production expectations worsening and stocks of finished goods increasing; however, confidence and expectations improved slightly in July.
The main contributors to growth in the first half of the year were trade, transport, accommodation and catering services, manufacturing and construction.
Chart 2. GDP developments and contributions (by production approach, left-hand panel) and developments in manufacturing, retail trade, construction and services (right-hand panel)
Sources: State Data Agency and Lietuvos bankas calculations.
* Including accommodation and catering services.
** Excluding trade in motor vehicles and motorcycles.
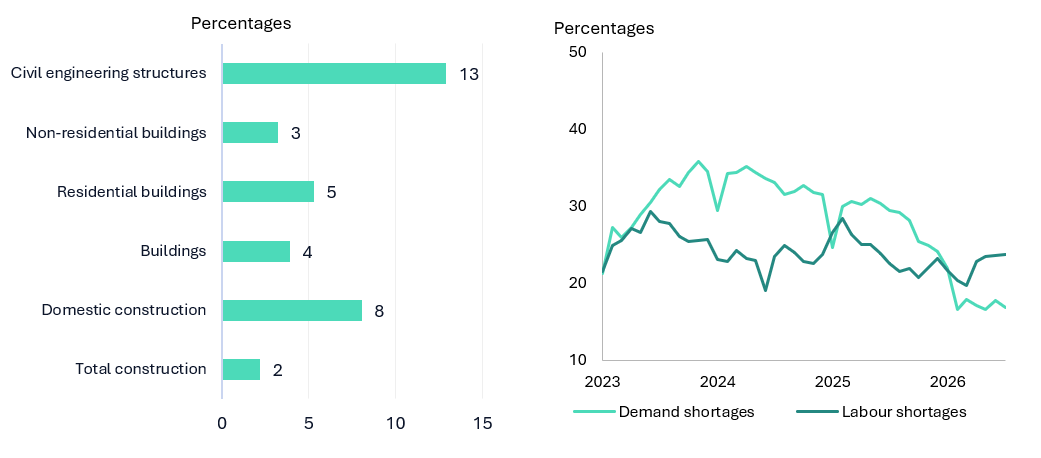
The performance of the construction sector differed significantly between the first and second quarters. In the first quarter, the sector contracted (quarter-on-quarter growth of -1.9%), but in the second quarter the construction sector recovered (quarter-on-quarter growth of 6.1%). In the first half of the year, compared to the same period last year, the volume of construction work in Lithuania increased by 8%, with the construction of civil engineering works growing particularly rapidly at 12.9%. The growth in the construction of civil engineering works was likely driven by increasing public sector investment in infrastructure, including defence infrastructure. Furthermore, an increasingly smaller proportion of construction firms report demand shortages (see Chart 3), which suggests that, once the labour shortage has been resolved, the construction sector should continue to grow.
Chart 3. Year-on-year changes in the construction sector for the second half of the year (left-hand panel) and constrains reported by construction firms (right-hand panel)
Sources: State Data Agency and Lietuvos bankas calculations.
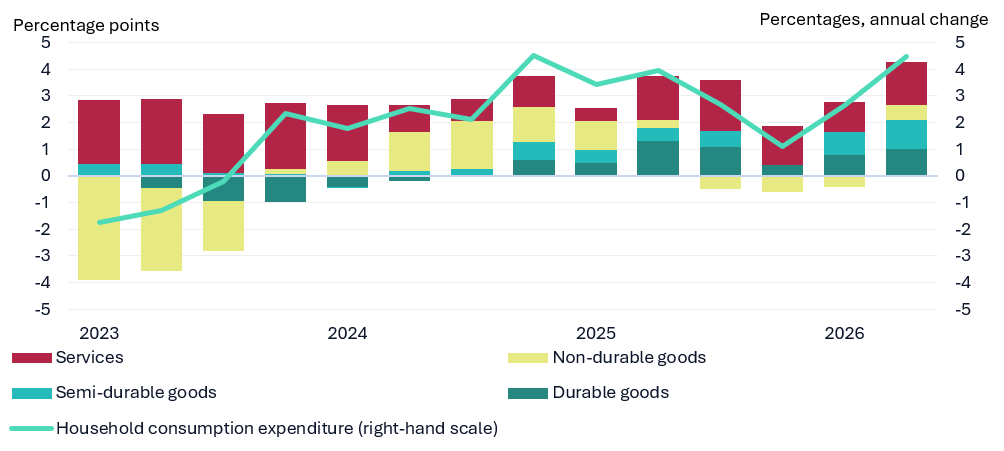
Retail trade grew strongly in the second quarter, while market services grew more moderately. Retail turnover (excluding trade in motor vehicles) rose by 3.6% quarter on quarter and 7% year on year. Trade growth was supported by rising household purchasing power, as wages grew by 9.3% in the first quarter, and rising household consumption (see Chart 4), which was further bolstered by the 2nd pension pillar reform (for more see Box 3). Consumer confidence improved but confidence in the retail sector fell in May and continued to deteriorate in June, mainly due to a decline in expectations regarding business activity.
Overall, economic growth in the first half of 2026 was underpinned by rising purchasing power and household consumption.
Chart 4. Household consumption developments and contributions
Sources: State Data Agency and Lietuvos bankas calculations.
Investment remains a key driver of further economic growth and its outlook in 2026 is expected to be supported by higher public sector investment and recovering demand for investment from private firms. Although the overall investment growth slowed in the first quarter, investment in the second quarter was supported by increased construction activity, particularly in civil engineering. Investment growth is expected to continue to accelerate, driven by higher public sector investment, including defence and infrastructure spending as well as the absorption of EU funds. Investment is forecast to grow by 8.2% in 2026, 5.7% in 2027, and 5.1% in 2028.
Looking at the bigger picture, economic growth should continue to be driven by domestic demand, particularly household consumption and investment. Consumption growth will be further boosted by withdrawals from the second pension pillar as data indicate that a large proportion of these funds has not yet been spent. Hence, the impact of the reform on consumption may still be felt in the coming quarters. The outlook for external demand is improving but the developments in the world economy remain subject to considerable uncertainty exacerbated by geopolitical tensions and risks relating to the supply of energy resources, including through the Strait of Hormuz. Real GDP is projected to grow by 2.7% in 2026 and by 2.4 and 3.1% in 2027 and 2028 respectively.
Prepared by Ernestas Virbickas
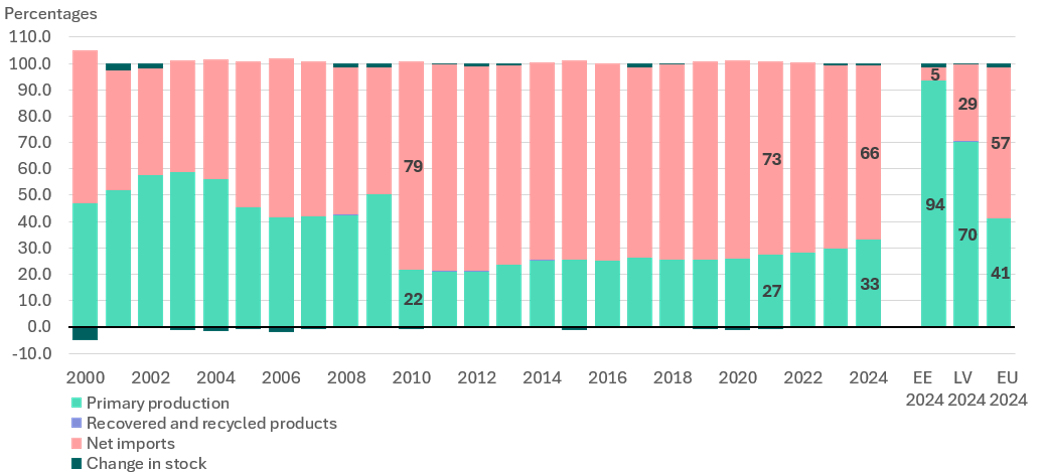
Two-thirds of energy needs in Lithuania are met by imports, but this dependence is declining.
Chart A. Structure of gross available energy by energy origin in Lithuania, other Baltic states and EU as a whole
Sources: Eurostat and Lietuvos bankas calculations.
Note: Calculations are based on data on energy from various sources, measured in tonnes of oil equivalent; net imports are calculated as the difference between energy imports and exports.
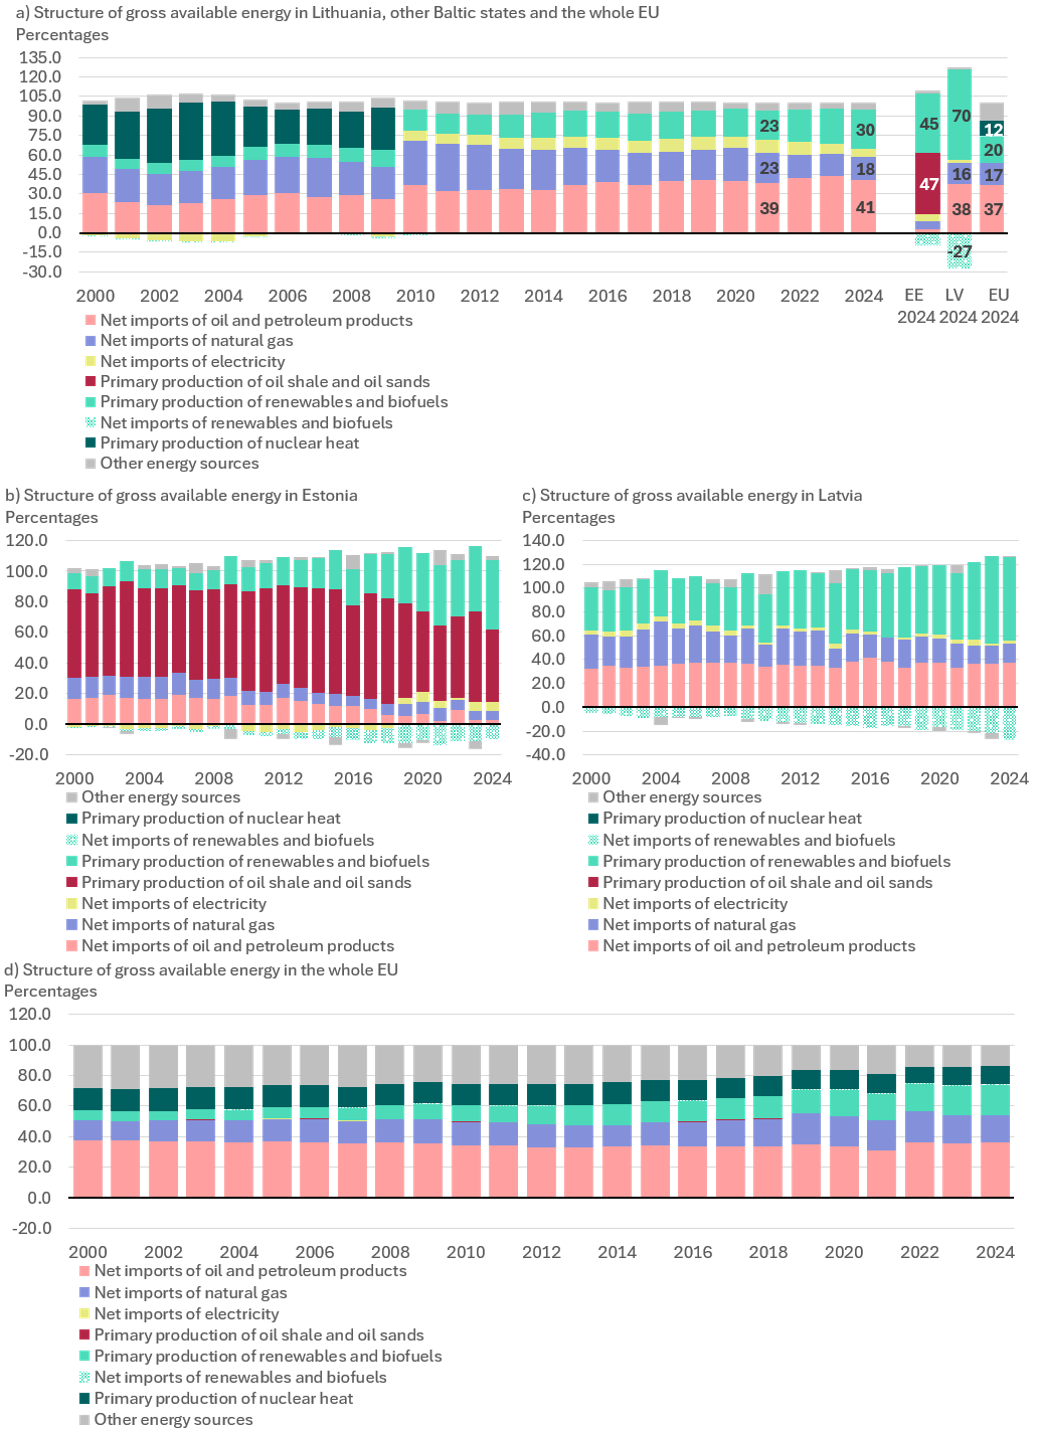
Renewables are becoming increasingly important in Lithuania, while dependence on imported gas and imported electricity is declining.
Chart B. Structure of gross available energy by product type and origin in Lithuania, other Baltic states and EU as a whole
Sources: Eurostat and Lietuvos bankas calculations.
Note: Calculations are based on data on energy from various sources, measured in tonnes of oil equivalent; net imports are calculated as the difference between energy imports and exports.
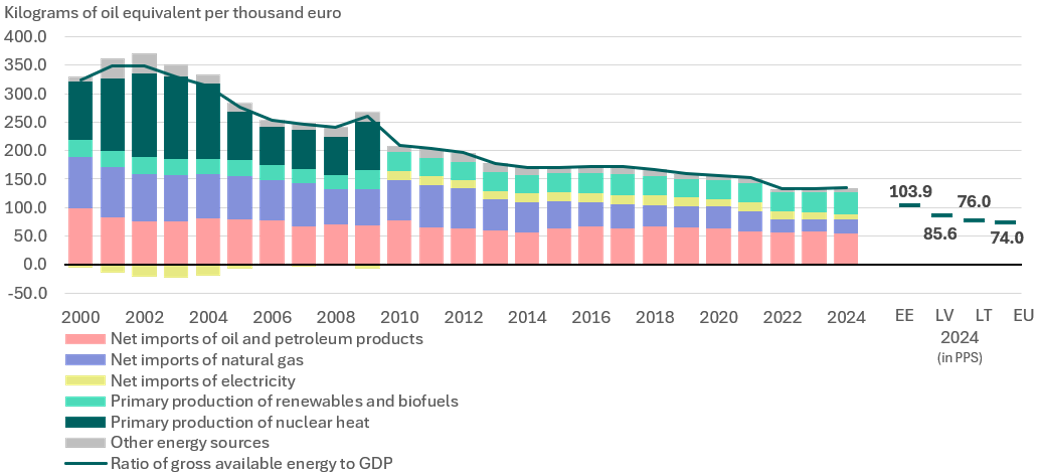
Positive trends in the energy sector are also observed at the EU level, which has a favourable impact on Lithuania’s tradable sector. At the EU level, there is a consistent shift towards renewable energy sources; the importance of imported and domestically produced natural gas is declining, as is the role of imported and domestically produced solid fossil fuels (see Chart B, panel d). Energy intensity is gradually declining at the EU level.
In Lithuania, energy intensity is falling, with an increasingly smaller amount of energy being used to generate one unit of real GDP.
Chart C. Energy intensity (ratio of gross available energy to real GDP) in Lithuania and energy intensity in the Baltic states and EU as a whole, in PPS
Sources: Eurostat and Lietuvos bankas calculations.
Note: Calculations are based on data on energy from various sources, measured in tonnes of oil equivalent; net imports are calculated as the difference between energy imports and exports; right-hand panel shows data on energy intensity for Estonia, Latvia, Lithuania and the whole EU in PPS.
In summary, resilience of Lithuania’s economy to energy price shocks has increased. The share of imported energy is falling, dependence on imported natural gas and imported electricity is waning, renewables are gaining greater prominence. The economy’s energy intensity is steadily declining – an increasingly smaller amount of energy is needed to generate one unit of real GDP. The tradable sector is also benefiting from improved energy resilience across the EU. Admittedly, there is both scope and need to reduce energy dependence further, as the share of imported energy remains relatively high (at 66%), and is higher than in many EU countries.
Prepared by Darius Imbrasas
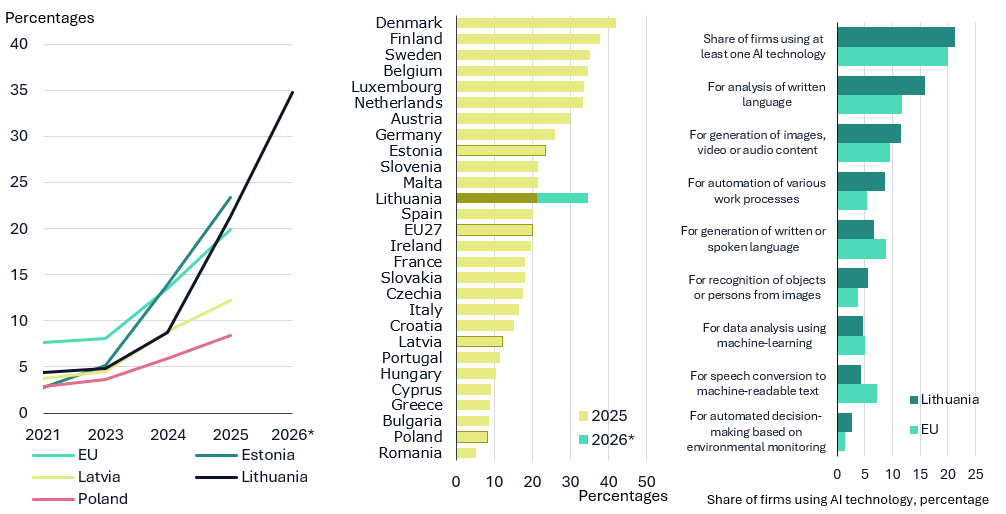
The use of AI technologies is growing rapidly in Lithuania. In 2021–2026, the share of businesses using at least one AI technology rose from 4.5% to 34.7% (see Chart A). In 2026, Lithuanian companies mostly used AI technologies to analyse written language and to generate images, video or audio content, and these were used by 27.6% and 21.8% of companies respectively. More than a tenth of Lithuanian companies used AI technologies to automate various workflows (14.3%) and to generate written and spoken language (12.4%). The lowest share of companies used AI technologies designed for automated solutions based on environmental monitoring, enabling machines to move physically, and for analysing data using machine learning: these were used by just 3.6% and 6.4% of companies respectively.
Based on 2025 data, the main areas in which the AI technology was deployed were marketing and sales (7.8% of Lithuanian companies), organisation of business administration processes (7.3%), and accounting, control or financial management (6.6%). In areas such as logistics (2.8%), production processes (3.7%) or research and development (R&D) and innovation (4.7%), AI technologies were used less frequently. However, even in these areas, Lithuanian companies rank between the EU average and the EU leaders: in terms of use of AI technologies in production processes, Lithuania ranked 16th (led by Sweden at 9.2%, Austria at 7.6%, the Netherlands at 6.9%); in terms of use in R&D and innovation, it ranked 9th (the Netherlands and Finland at 8.5%, Belgium at 7.6%); and in terms of use in logistics, it ranked 2nd (second only to Denmark at 3.6%).
The use of AI technologies is expanding rapidly in Lithuania: the share of firms using at least one AI technology is higher than the EU average.
Chart A. Share of firms using at least one AI technology (left-hand panel), share of firms using at least one AI technology in EU Member States (central panel) and share of firms using certain AI technologies in Lithuania and the EU (right-hand panel)
Sources: Eurostat and Lietuvos bankas calculations.
* Data for 2026 – Lithuania only.
The share of Lithuanian businesses using at least one AI technology is higher than the EU average. According to the latest data, the share of businesses using at least one AI technology in 2025 stood at 21.3% in Lithuania, compared to 20.0% in the EU (see Chart A). A larger share of Lithuanian firms used AI technologies for purposes such as written language analysis, automation of various work processes, generation of images, video or audio content, and automated decision-making based on environmental monitoring, while a smaller share used speech-to-machine-readable-text conversion and generation of written or spoken language.
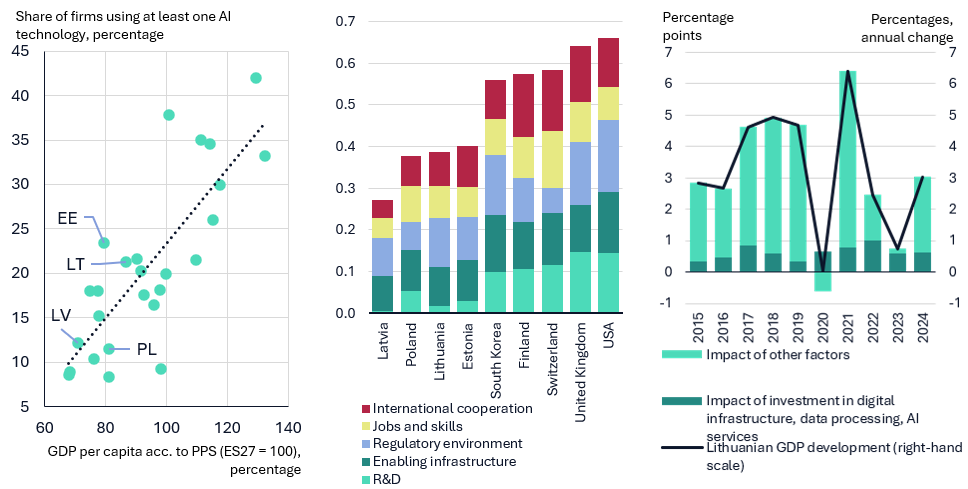
In Lithuania, the share of businesses using at least one AI technology is higher than the EU average; however, Lithuania lags significantly behind the leading countries. In 2025, in the top-performing countries, the share of firms using at least one AI technology was almost double that in Lithuania: it stood at 42.0% in Denmark, 37.8% in Finland and 35.0% in Sweden. On the other hand, among its closest neighbours, Lithuania’s figure is quite favourable as it lags only slightly behind Estonia (23.4%), while significantly outperforming Latvia (12.2%) and Poland (8.4%). Lithuania’s considerable lag behind the leading EU Member States is in line with general global trends, with research showing that the uptake of AI technologies in businesses correlates positively with a country’s income level. This correlation is evident when examining the relationship between the standard of living (measured by GDP per capita adjusted for the purchasing power standard (PPS)) and the share of businesses using at least one AI technology across the EU Member States (see Chart B). It should be noted that Lithuania, like the other Baltic states, ranks above the average level implied by the correlation observed in the data, which indicates that the prevalence of AI technologies is relatively higher than would be expected given Lithuania’s level of development.
Lithuania’s AI ecosystem is fairly balanced, and the uptake of AI technologies is in line with global trends. Investment in digital infrastructure, data processing and provision and use of AI services have contributed significantly to the Lithuania’s economic growth in recent years.
Chart B. Relationship between living standards and the use of AI technologies in EU Member States (left-hand panel), 2024, OECD. AI index* values in certain countries (central panel) and impact of investment in digital infrastructure, data processing and AI services on Lithuania’s economic growth** (right-hand panel)
Sources: OECD, Eurostat and Lietuvos bankas calculations.
* The index values are standardised, i.e. the lowest theoretical index value is 0 and the highest is 1. For more information on the methodology used to compile the index see the OECD publication The OECD.AI Index. Technical paper.
** The impact of investment in digital infrastructure, data processing and AI services on economic growth in Lithuania has been calculated using the methodology set out by Carpinelli L., Natoli F. and Taboga M. in ‘Artificial Intelligence and the US Economy: An Accounting Perspective on Investment and Production’, Bank of Italy Occasional Papers N. 1006, March 2026.
International comparisons show that Lithuania’s AI ecosystem is fairly balanced but does not stand out internationally in any particular area. According to the OECD’s AI Index (see Chart B), Lithuania’s AI ecosystem in 2024 was classified as belonging to the group of OECD countries with an average rating. According to this index, Lithuania’s strongest position is in the AI regulatory environment. This component covers the use of AI by public sector bodies, venture capital investment and AI governance structures. The indicators for enabling infrastructure as well as jobs and skills are in line with the OECD average. The first indicator covers the availability of high-speed internet, access to open data and local computing capacity; the second covers the supply and expertise of employees using AI as well as the number of AI projects. However, the greatest lag is observed in the indicators for international cooperation covering international initiatives and scientific collaboration and R&D, which encompasses the production of high-quality AI publications, AI patents and models. This is particularly true of the R&D sector: Lithuania’s index value in this area stood at merely 0.09, while the average for OECD countries was close to 0.34 and that of the leading countries was 0.7. It is also important to emphasise that the success of development of AI technologies is not restricted to government efforts. In addition to factors such as a country’s demographic indicators or differences in economic structure, the attitudes of business executives play a significant role for the development of AI technologies. In companies where managers provide the technical resources and actively encourage employees to adopt AI technologies, these technologies spread more rapidly (Bick, 2026).
Although current assessments of the potential impact of AI technologies on labour productivity in Lithuania are not particularly favourable, investment in and adoption of these technologies contribute significantly to the country's economic growth. Based on the methodology presented by Carpinelli (2026), which attempts to assess the impact of the adoption and development of AI technologies on a national economy, a relevant estimate was also derived for the Lithuanian economy. The analysis shows that investment in digital infrastructure, data processing and provision and use of AI services accounted for a significant share of Lithuania’s economic growth (see Chart B). Between 2015 and 2024, these investments and services accounted, on average, for around one-fifth (0.6 percentage points) of Lithuania’s economic growth each year. Meanwhile, between 2020 and 2024, this share increased even further to nearly 30%. The growing impact of investment in digital infrastructure, data processing and AI services on economic growth reflects the ongoing transformation of the Lithuanian economy, which could potentially also boost labour productivity. This should contribute to Lithuania’s continued convergence with the world’s wealthiest nations.
Prepared by Darius Imbrasas and Daumantas Skinkys
In June 2025, the Lithuanian parliament approved the reform of the 2nd pension pillar, which came into force early in 2026. This reform abolished the automatic enrolment of residents in the scheme and provided more flexibility for those already saving by allowing them to suspend contributions for an unlimited number of times, withdraw up to 25% of their accumulated assets on a one-off basis as well as providing for additional options to withdraw due to serious health conditions. However, the greatest short-term impact on the economy comes from the two-year transition period (2026–2027) during which residents who have been saving can opt out of the 2nd pillar entirely. In such cases, they will be paid their own contributions and full investment return, while the contributions previously transferred from the State Social Insurance Fund (Sodra) and public incentive contributions will be transferred to the Sodra and converted into additional pension units.
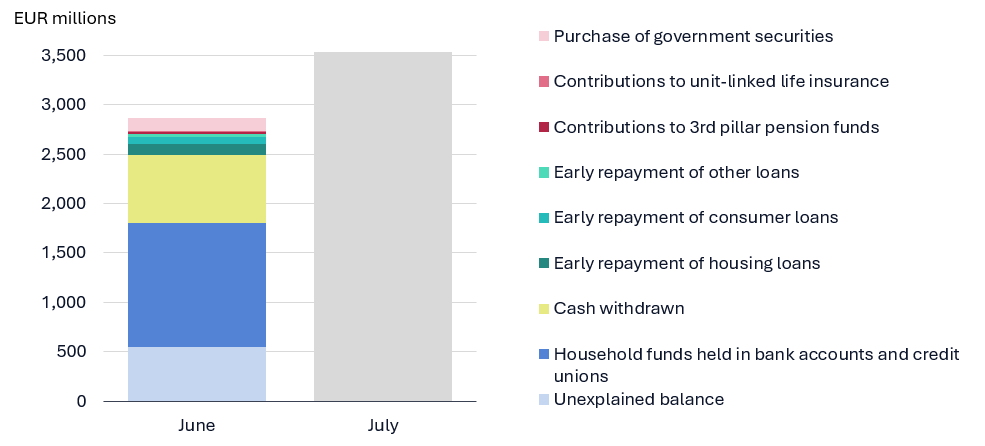
A large share of the funds received remained in the households' bank accounts in June. More detailed data on the use of the funds are currently available up to June. These data allow us to assess the households' initial reaction upon receiving the funds. According to the data for June, 44%, or €1.3 billion, paid out to residents remained in deposits. A further €780 million, or 27%, was withdrawn in cash. Residents used nearly €210 million (7%) to repay loans, of which €110 million went towards reducing housing loans, €80 million towards consumer loans and €20 million towards other loans. €160 million (6%) was channelled into investment instruments, of which €130 million was used to purchase Lithuanian government securities, €20 million was transferred to the 3rd pension pillar and €10 million was spent on unit-linked life insurance. The calculation methods used do not yet account for approximately 16% of the use of the funds received. It is important to treat these statistics with caution as they are not final.
Following the withdrawals from the 2nd pension pillar, €3.5 billion was transferred to Lithuanian households, with most of these funds still remaining in their bank accounts.
Chart A. Funds paid out to residents from the 2nd pension pillar
Sources: Lietuvos bankas calculations; preliminary estimates based on available data and assumptions.
Note: Calculations were carried out by assessing statistically significant deviations from the usual development of indicators.
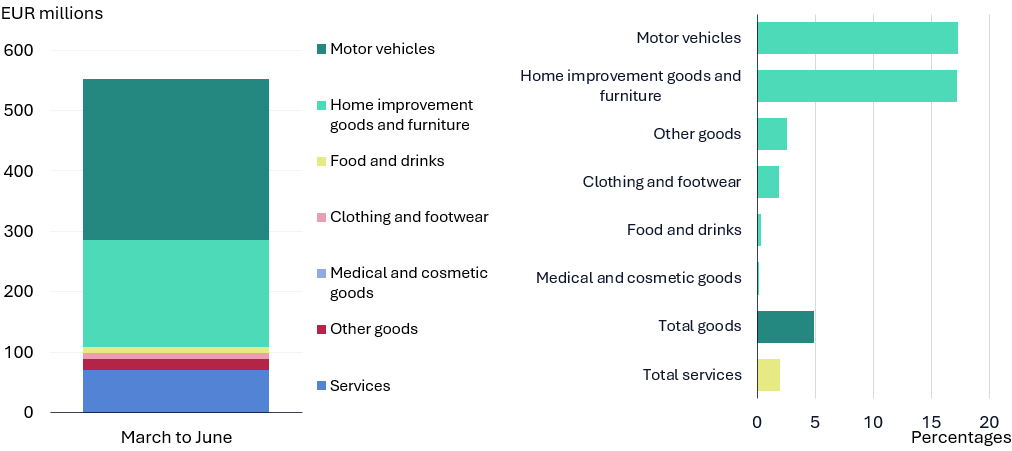
Withdrawals from the 2nd pension pillar in the first half of 2026 are likely to have contributed significantly to the growth of household consumption.
Chart B. Increase in sales of goods and services between March and June compared to the baseline scenario* at current prices (left-hand panel) and estimated increase at constant prices (right-hand panel)
Sources: State Data Agency and Lietuvos bankas calculations; actual turnover surplus compared to the projected trend.
*The forecast is based on actual, seasonally unadjusted turnover data using a SARIMA or other seasonal model, calibrated separately for each expenditure category. Nominal household expenditure figures are derived using sector-specific price deflators and taking VAT into account. Only those segments of expenditure on goods and services are included where the surplus, compared to the projection, is statistically significant (based on a 95% confidence interval), totalling around €0.5 billion. Based on an 80% confidence interval, the total expenditure amounts to €0.7 billion. Home improvement goods and furniture is a spending category that includes the retail sale of audio and video equipment, metal products, furniture and lighting equipment in specialised shops.
The impact of funds withdrawn from the 2nd pension pillar on Lithuania’s economic growth should be more moderate than expected. Available data show that households have increased their spending on goods and services by a smaller margin than had been forecast in previous assessments by Lietuvos bankas. According to updated estimates, funds withdrawn from the 2nd pension pillar are expected to bolster household consumption growth by 1.3 percentage points this year; however, this impact is likely to be short-lived and should not provide a significant additional boost to domestic demand in the future. Owing to a higher base effect, the impact of these funds is expected to weaken household consumption growth by 1.7 percentage points in 2027, before increasing it again by 0.4 percentage points in 2028. The latter effect is linked to the end of the transitional period during which residents may opt out of the 2nd pension pillar and to a larger likely wave of opt-outs at the end of 2027. Given the significant share of imported goods and services in the structure of household consumption, the projected impact on Lithuania’s economic (GDP) growth is expected to be smaller. In 2026, it is expected to amount to 0.4 percentage points, dampen growth by 0.4 percentage points in 2027, before increasing it by 0.1 percentage points in 2028. According to updated estimates, the impact of funds withdrawn from the 2nd pension pillar on inflation should be minor, increasing inflation by just 0.1 percentage points in 2026.
3.Labour market
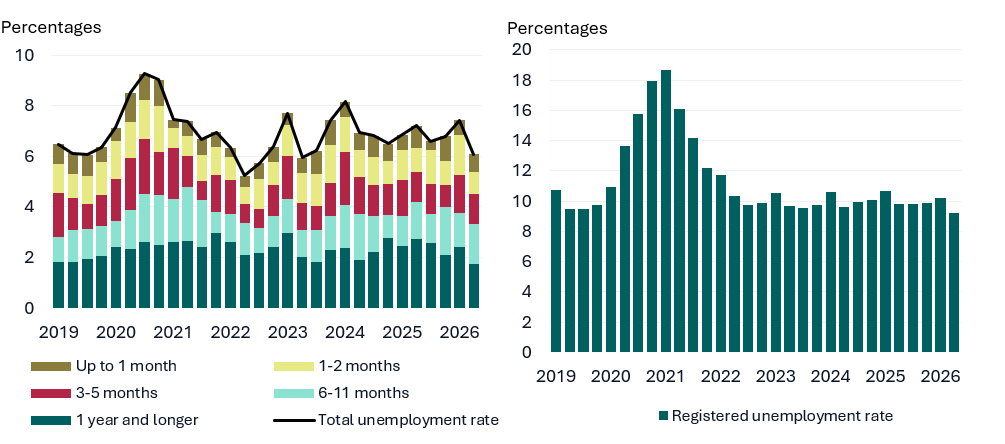
Following slightly weaker labour market developments last year, more favourable trends have been observed this year, with the number of people in employment rising again and unemployment rate falling significantly. Hiring has picked up: after showing no growth last year, the number of people in employment grew at an annual rate of 1.0% in the first half of this year. However, employment trends varied across economic sectors: manufacturing contributed most to employment growth, with employment in the first half of the year rising by 11.6% year on year, while employment in information and communication fell by almost a fifth year on year and was the main factor holding back employment growth. As employment rose, the unemployment rate in Lithuania fell considerably as it stood at 6.1% in the second quarter of this year, down by 1.1 percentage points year on year (see Chart 5, left-hand panel). The decline in unemployment is also confirmed by the registered unemployment rate, which fell by 0.6 percentage points over the year (see Chart 5, right-hand panel). The decline in the unemployment rate was mainly driven by a reduction in the share of long-term unemployed. In the second quarter, long-term unemployment fell by 0.9 percentage points year on year to 1.8%. The unemployment rate is projected to stand at 6.7% in 2026 and at 6.6% in both 2027 and 2028.
The unemployment rate fell significantly in the second quarter of this year, while employment, which did not grow last year, began to rise again.
Chart 5. Unemployment rate and contributions based on data from the Labour Force Survey (left-hand panel) and registered unemployment (right-hand panel)
Sources: State Data Agency, Employment Service and Lietuvos bankas calculations.
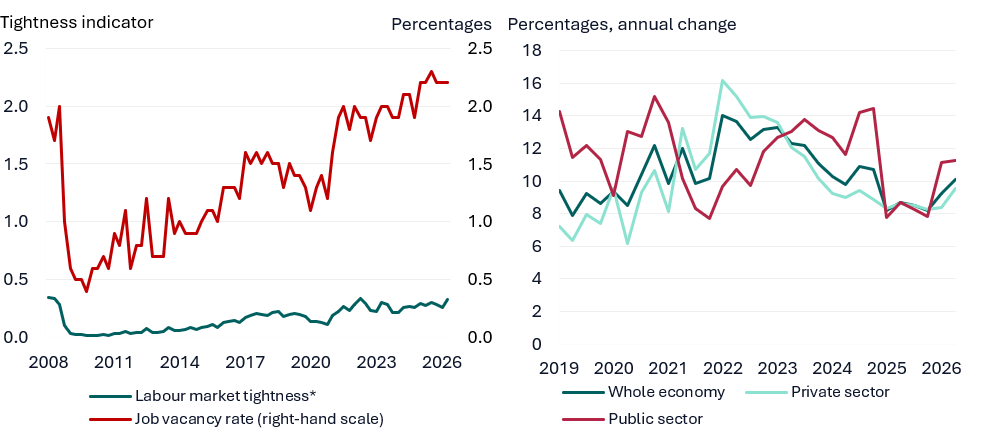
With labour market tightness still elevated and job vacancy rate remaining close to historical highs (see Chart 6, left-hand panel), wages have risen at a faster pace. In the first half of this year, the job vacancy rate in Lithuania stood at 2.2% and was close to historical highs. The highest job vacancy rate continued to be recorded in public administration and defence and compulsory social security, where it continued to rise and was more than triple the national job vacancy rate. Unabated demand for labour sustained rapid wage growth. Following last year’s slowdown, wages regained momentum this year: in the second quarter of 2026 they rose by 10.1% year on year (see Chart 6, right-hand panel). With wage growth in the public and private sectors broadly tracking one another last year, trends diverged this year, with public sector wages rising more rapidly (11.3%), while private sector wages grew at a more moderate rate (9.6%). These trends of private sector wage growth may have been affected for some time by the marked increase in the labour share, which continues to rise.
Looking ahead, it should be noted that the labour market situation will remain favourable for employees. Persistent tightness in the labour market will sustain wage growth, which is projected to reach 9.4% in 2026 and then fall to 7.6% in 2027 and 7.0% in 2028.
With the labour market still tight, wages have risen at a faster rate.
Chart 6. Development of job vacancy rate and labour market tightness (left-hand panel) and wage development (right-hand panel)
Sources: State Data Agency and Lietuvos bankas calculations.
Note: The level of labour market tightness is measured by the ratio of job vacancies to the unemployed.
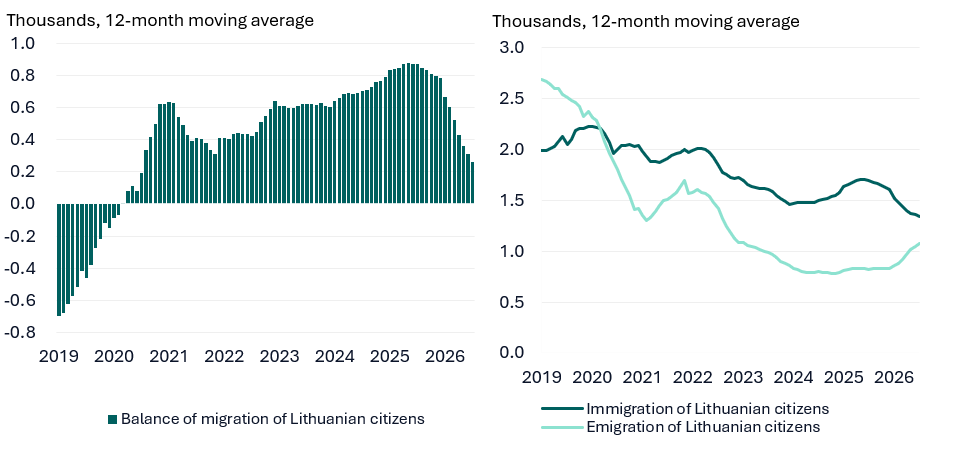
The emigration flow of Lithuanian citizens is increasing, while immigration is slowing down.
Chart 7. Migration balance of Lithuanian citizens (left-hand panel) and international migration of Lithuanian citizens (right-hand panel)
Sources: State Data Agency and Lietuvos bankas calculations.
Prepared by Ernestas Virbickas
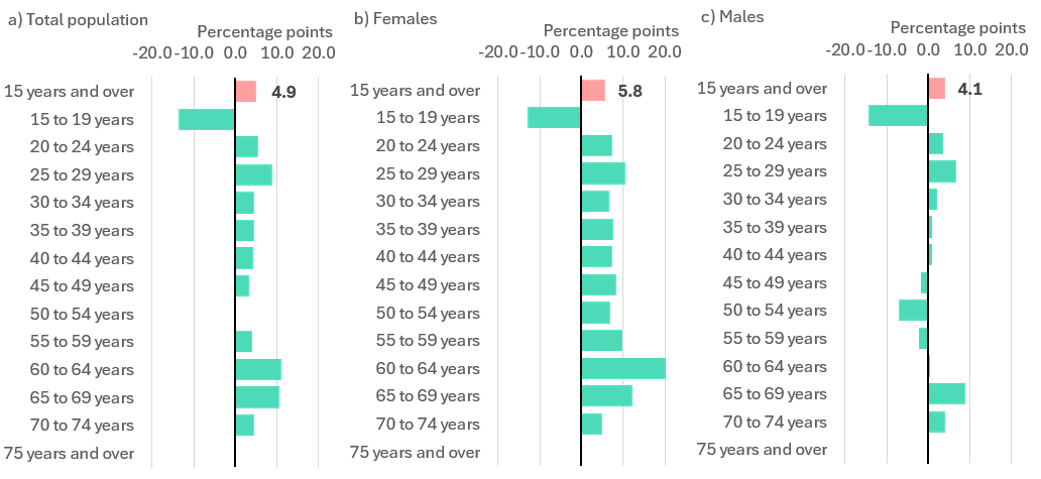
The labour force participation rate in Lithuania is well above the EU average. It is higher in most age groups, with the exception of the youngest group (aged 15–19).
Chart A. Difference between the labour force participation rates in Lithuania and the EU in 2025
Sources: Eurostat and Lietuvos bankas calculations.
The changing age structure of the population makes a negative impact on the overall participation rate in Lithuania. The share of the population with the highest participation rate is declining and is projected to continue falling.
Chart B. Age structure of the population and labour force participation rate in Lithuania
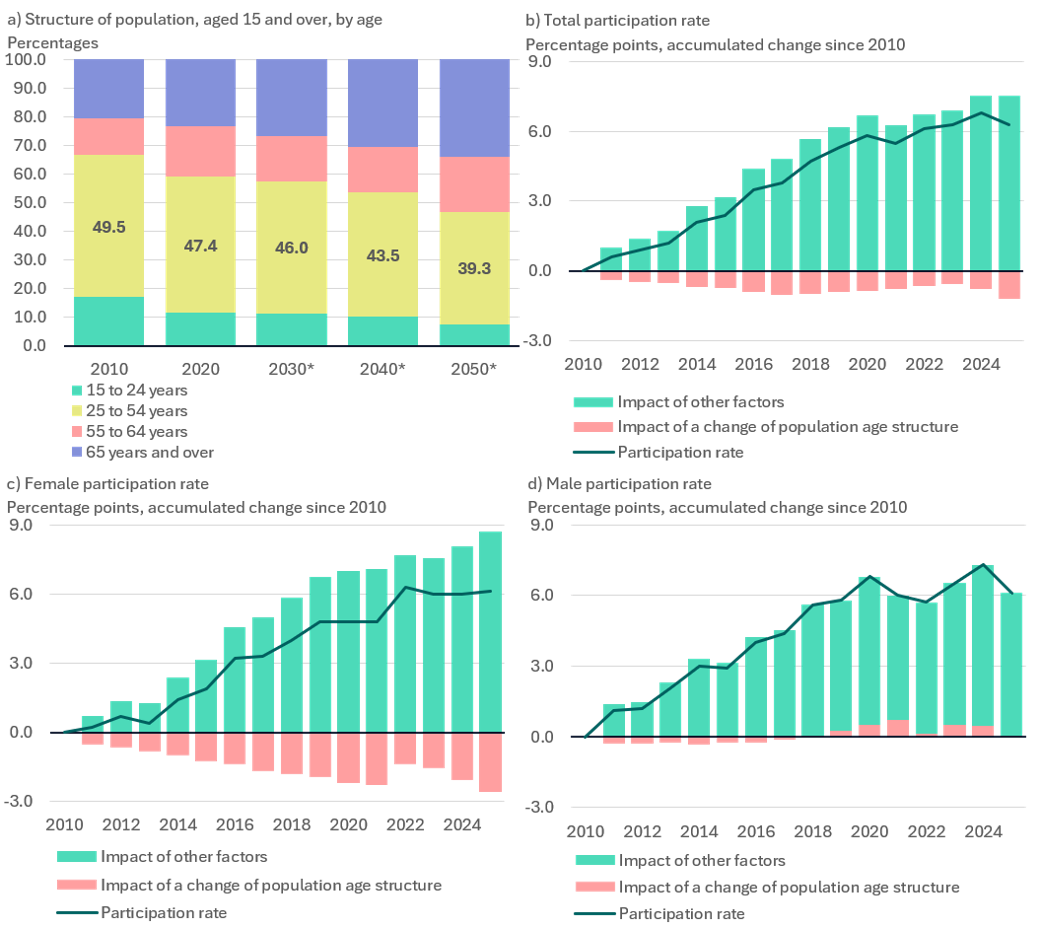
Sources: Eurostat, State Data Agency and Lietuvos bankas calculations.
* Projection; based on the EC projections published in 2026.
Due to changes in the age structure of the population, the overall participation rate in Lithuania may fall by one tenth over the next 25 years. It may also decline in many other EU countries.
Chart C. Labour force participation rates in Lithuania, other Baltic states and the EU as a whole
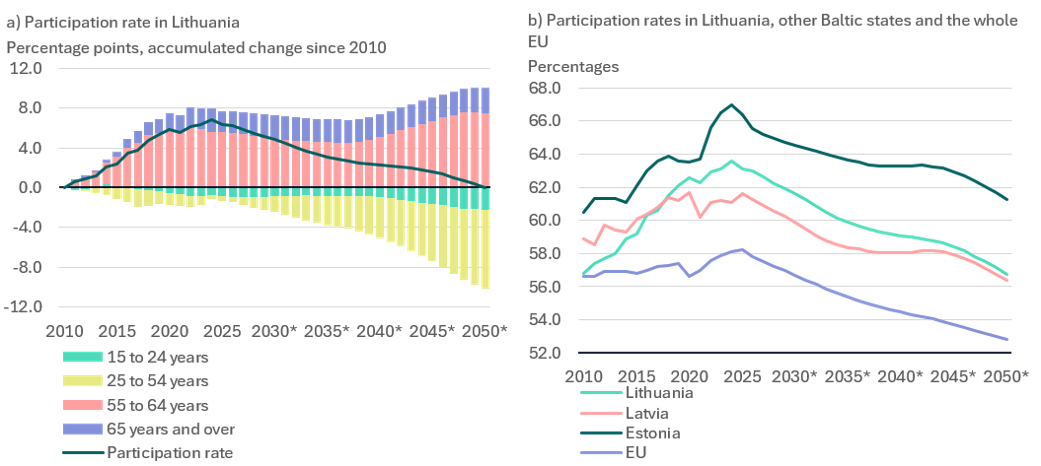
Sources: Eurostat and Lietuvos bankas calculations.
* Projection; the projection horizon begins in 2026.
Prepared by Linas Tarasonis and Dominykas Vaičiūnas
Employment growth over the sample period has been driven overwhelmingly by non-EU workers, against an essentially flat Lithuanian workforce. Throughout, employment is measured as the number of filled positions (job spells) rather than individuals; since some people hold more than one job, the number of employed individuals is somewhat lower. The left panel of Chart A contrasts Lithuanian nationals with all foreign workers. Employment among Lithuanian nationals remained broadly stable at around 1.3 million throughout the period, edging down slightly after 2016, so that essentially all of the net change in employment came from foreign workers. The right panel splits the foreign workforce into its EU and non-EU components, on a scale that makes their very different trajectories visible. Non-EU employment expanded roughly twelve-fold, from about 11,500 workers in 2010 to some 143,100 by 2024, with the increase gaining pace from 2019 onwards, while EU employment grew far more modestly, from about 1,900 to 4,500 workers. As a result, the non-EU share of total employment rose from about 1% in 2010 to roughly 10% by 2024, whereas the EU share remained well under 1% throughout – leaving the non-EU group around thirty times larger than the EU group by 2024. The growth was thus far from homogeneous across the two foreign groups: EU employment a little more than doubled over the period, whereas non-EU employment multiplied roughly twelve-fold, making non-EU nationals the dominant margin of foreign labour growth.
Chart A. Employment by nationality over time (Lithuanians vs foreigners, left-hand panel) and a more detailed breakdown of non-Lithuanian employment into EU vs non-EU foreigners (right-hand panel)
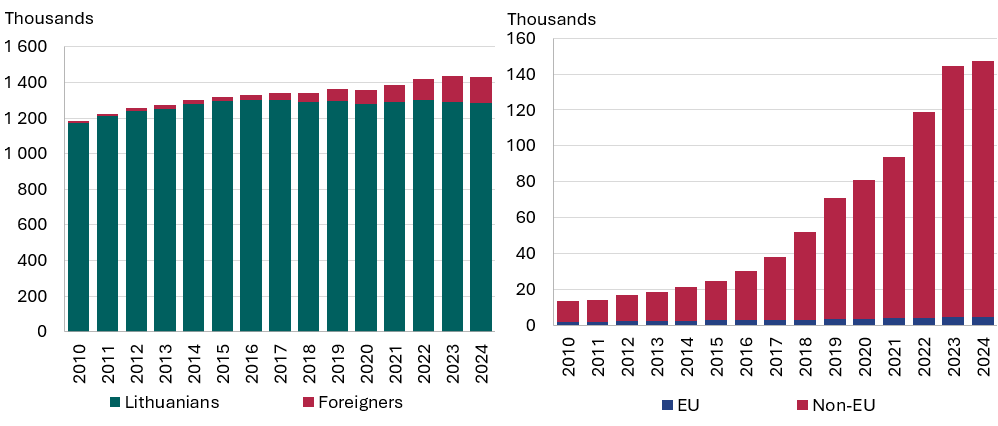
Sources: Sodra and Bank of Lithuania calculations.
The three groups differ systematically in age and, especially, gender composition, and these differences have widened over time. The Lithuanian workforce is ageing steadily and most rapidly of the three groups: its mean age rose from about 42 years in 2010 to around 45 by 2024 (Chart B, left-hand panel), consistent with broader demographic pressures, making it the oldest group throughout. The two foreign groups are younger and moved in opposite directions. EU workers grew modestly older, from about 40.5 to 41.6 years, staying notably younger than Lithuanian employees despite the general ageing of the EU population. Non-EU workers began as the second-oldest group, at around 42.7 years, but their mean age dropped sharply from around 2016 – falling roughly two years to about 40.5 by 2024 as the group expanded. As a result, non-EU workers are now the youngest group, with both groups of foreign workers well below the average age of Lithuanian nationals.
Gender differences are more pronounced (Chart B, right-hand panel). Employment among Lithuanian nationals is predominantly female, with the male share remaining stable at around 46%. EU employment is roughly three-quarters male throughout. The non-EU group is the most male-dominated and increasingly so: its male share climbed from about 69% in 2010 to a peak near 92% in 2019–2021, easing back to about 84% by 2024. As the two foreign groups grow in size, they pull up the male share of total employment in Lithuania.
Chart B. Mean age (left-hand panel) and male share (right-hand panel) of employment by nationality
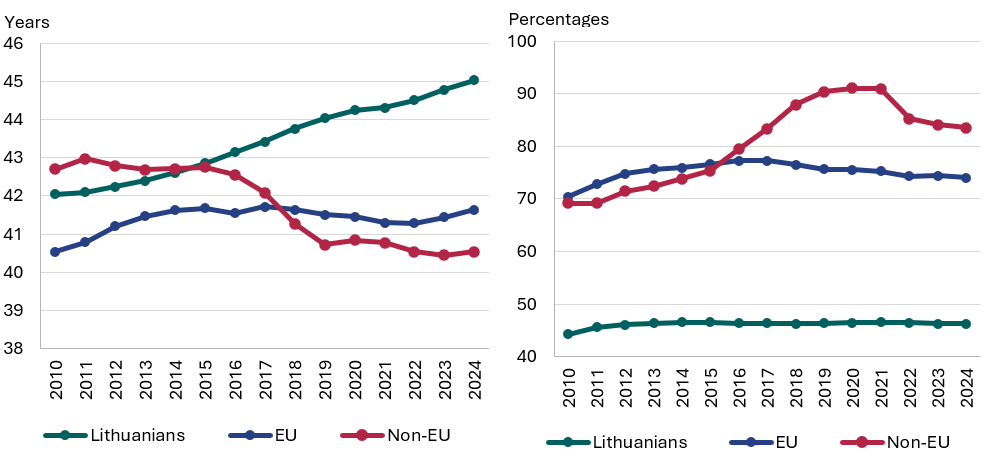
Sources: Sodra and Bank of Lithuania calculations.
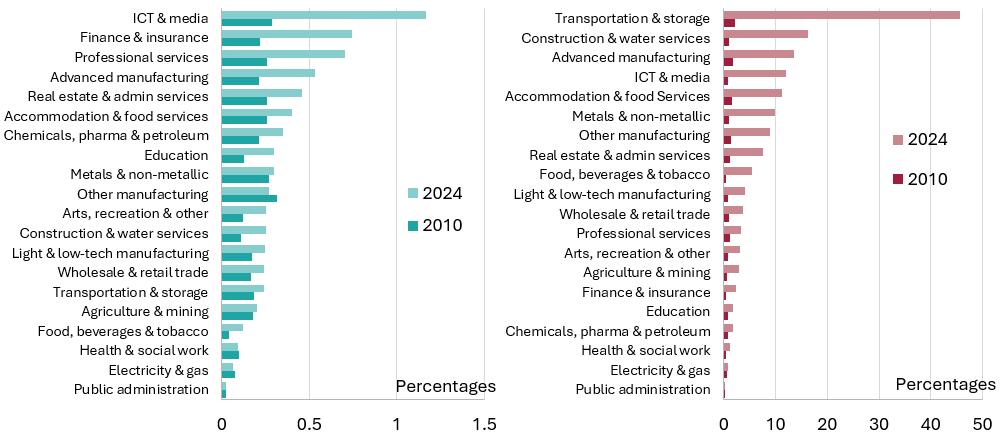
Foreign labour is highly concentrated by sector, and the two foreign groups occupy very different parts of the economy. Chart C shows the share of each industry's workforce made up of EU and non-EU nationals in 2010 and 2024. For the EU group these shares remain small everywhere – below 1.5% in every industry even in 2024 – but despite this low base, EU employment grew strongly over the period, roughly doubling as a share of sectoral employment and rising most in higher-wage, knowledge-intensive sectors such as information and communication technology and media, finance and insurance, and professional services.
The non-EU group accounts for a far larger and more uneven share of sectoral employment. Its presence is overwhelmingly concentrated in transportation and storage, where non-EU workers rose from a negligible share in 2010 to about 46% of the sector's employment by 2024. The next two largest sectors for non-EU workers in 2024 were construction and water services, at around 16%, and advanced manufacturing, at around 14%. Two of these top three sectors – transportation and storage and construction and water services – are activities that pay below-average wages. This concentration means the Lithuanian economy has become materially more dependent on foreign labour in a small number of specific activities – most strikingly transportation, which by 2024 could not be staffed at anything like its current scale without non-EU workers. It also raises the question of whether the cost competitiveness of these sectors now rests on foreign labour.
Chart C. EU (left-hand panel) and non-EU (right-hand panel) share of employment by industry
Sources: Sodra and Bank of Lithuania calculations.
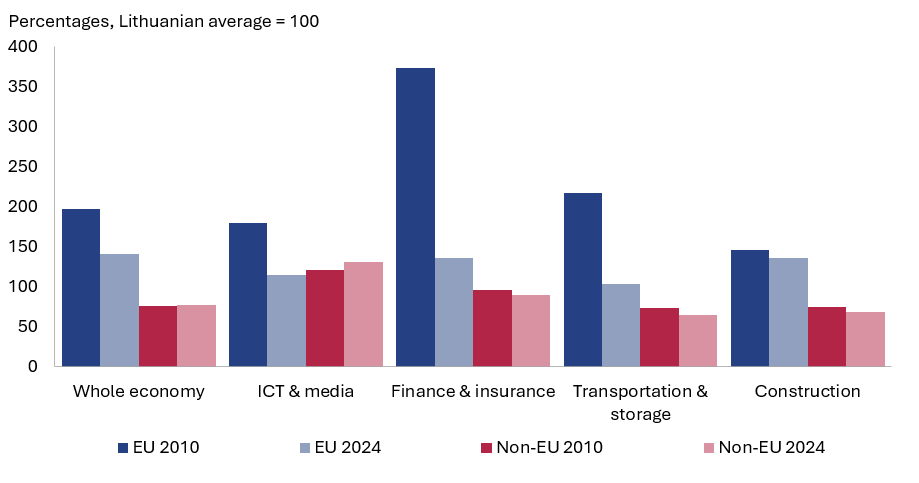
Wage gaps by nationality are large, but they are largely explained by the sectors migrants work in. Chart D expresses each foreign group's mean wage as a percentage of the Lithuanian mean within the same sector (Lithuanian = 100 in each sector), for the whole economy and four key sectors, in 2010 and 2024. The four sectors are the two most important for each foreign group – ICT and media and finance and insurance, where EU workers are most concentrated, and transportation and storage and construction, where non-EU workers are most concentrated. Wages here are daily wages – monthly income divided by the number of days employed – and, importantly, do not account for the number of hours worked. Pooling all sectors, the whole-economy figures show EU workers earning well above Lithuanians (about 41% more in 2024, down from roughly double in 2010), while non-EU workers earn only about 77% of the Lithuanian wage. But this economy-wide non-EU penalty conceals enormous variation across sectors. In ICT and media, non-EU workers actually out-earn Lithuanians – by about 20% in 2010, rising to roughly 30% by 2024 – and in finance they sit close to parity. By contrast, in transportation and storage, where most non-EU workers are employed, they earn only about 65% of the Lithuanian wage, and about 69% in construction. The aggregate gap is thus driven largely by the sectors non-EU workers are concentrated in, not by a uniform pay penalty: in the high-wage sector, where they are relatively scarce, they do very well, while in the low-wage sectors where they cluster the within-sector gap is widest. The EU premium, meanwhile, narrowed sharply within every sector – most dramatically in finance, where it fell from an exceptional level in 2010 toward more moderate figures by 2024.
Chart D. Wage gaps within sectors: EU and non-EU mean wage as a percentage of the same-sector Lithuanian wage (Lithuanian = 100), 2010 and 2024
Sources: Sodra and Bank of Lithuania calculations.
Beyond confirming the rapid rise of non-EU labour documented previously, the patterns above point to a more nuanced picture with distinct policy implications. The two foreign groups occupy very different positions in the labour market: EU workers are few but command a wage premium and cluster in high-wage, knowledge-intensive sectors, whereas non-EU workers are numerous, younger, overwhelmingly male, and concentrated in a handful of below-average-wage activities – most strikingly transportation, which could no longer operate at its current scale without them.
Crucially, the sector breakdown shows that the economy-wide non-EU wage penalty is largely compositional rather than a uniform disadvantage: where non-EU workers are scarce and highly skilled, as in ICT and Media, they out-earn Lithuanians, whereas in the low-wage sectors where they cluster they earn substantially less. This suggests the aggregate gap reflects mainly where non-EU workers are employed rather than systematically unequal pay for the same work – though a fuller answer would require decomposing the gap into a between-sector component (sorting into low-wage industries) and a within-sector component (pay differences within the same industry), and examining whether non-EU workers have comparable access to high-paying firms. The distinction matters for policy: a gap driven by sectoral sorting points toward measures easing mobility into better-paying sectors and firms, whereas a residual within-sector gap points toward equal-pay and anti-discrimination concerns.
A second implication is more structural: because non-EU workers are now so concentrated in a few activities – accounting for close to half of employment in transportation and a sixth in construction – the continued functioning and cost competitiveness of these sectors has come to depend materially on foreign labour. Any tightening of migration or work-permit policy would therefore fall unevenly across the economy, with an outsized effect on the specific sectors that have come to rely on non-EU workers – a dependence worth weighing explicitly when calibrating migration policy.
4.External sector
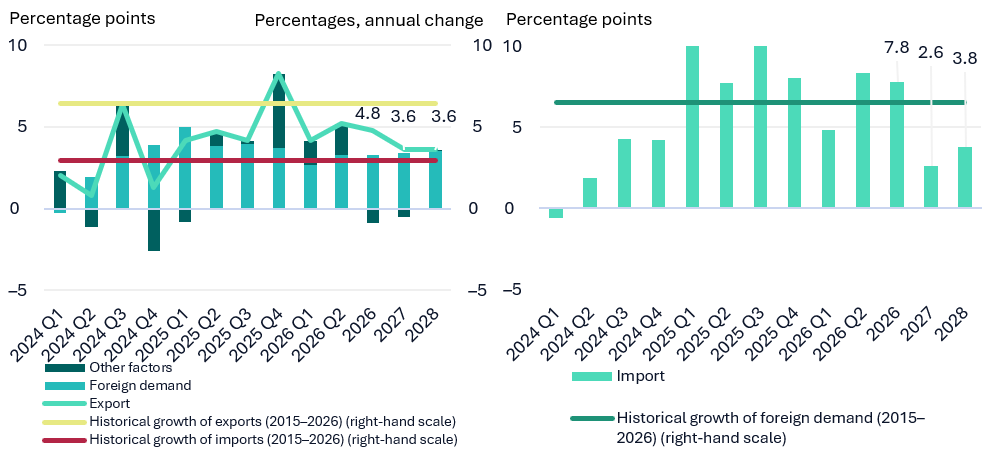
In the first quarter of 2026, the annual growth rate of real exports and imports slowed slightly, but recovered in the second quarter, although exports remained below their historical average growth rate. The outlook remains favourable and positive. Annual export growth was positive at 4.2% in the first quarter of 2026 and accelerated to 5.2% in the second quarter, although this represented a slight decline from the 8.2% annual growth recorded in the fourth quarter of 2025. This reflects the base effect that persisted since the start of 2025, i.e. a decline in exports due to expectations of high tariffs and trade uncertainty. Furthermore, although foreign demand had a favourable impact on export performance, it was lower than in 2025 due to the geopolitical situation; consequently, export growth was below the historical average for 2015–2026. The rate of import growth, partly driven by the same base effect, after three consecutive quarters rose to 8.4% in the second quarter of 2026. Faster import growth is narrowing Lithuania’s trade balance, but the trade balance remained in surplus in the first quarter of 2026. Annual export growth is projected to remain positive at 4.8% in 2026. However, due to weakening foreign demand, growth is set to slow to 3.6% in 2027 and 2028. Meanwhile, imports are expected to grow robustly, particularly in 2026, at a rate of 7.8%.
Chart 8. Historical development of the real exports of goods and services (left-hand scale) and imports (right-hand scale) (2-quarter moving averages) and their annual growth projections
Sources: State Data Agency, ECB, Lietuvos bankas and Lietuvos bankas calculations.
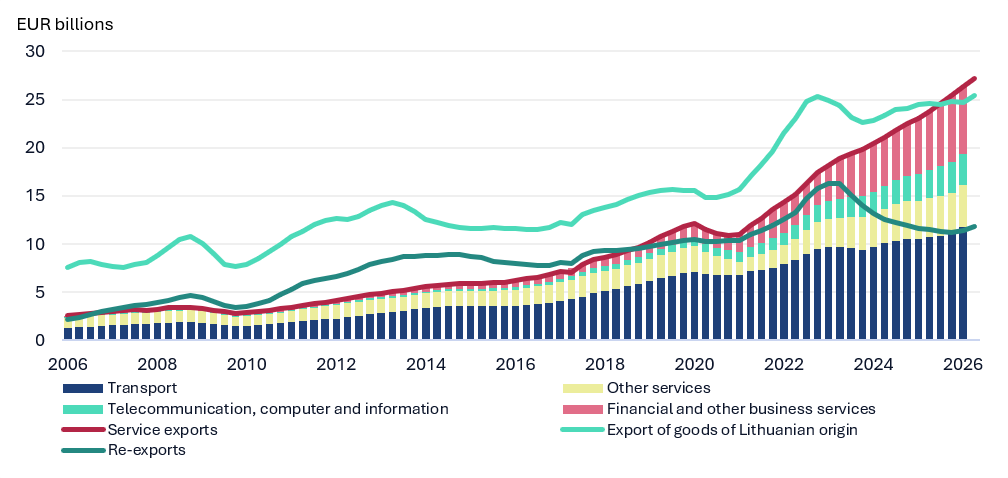
Having overtaken exports of goods of Lithuanian origin as early as the end of last year, exports of services continued to grow rapidly in the spring of 2026, with higher value-added services contributing significantly to this growth. In recent years, the development of individual export components has diverged significantly. The value of exports of goods of Lithuanian origin, despite short-term volatility, has remained broadly unchanged since 2022, though growth has been significantly dampened by a decline in exports to Western Europe. Despite this negative impact, export growth in other markets more than offset the decline in exports to Western Europe, with the annual growth rate of exports of goods of Lithuanian origin accelerating to around 7.4% in May 2026. The volume of re-exports has fallen significantly since peaking in 2022, and this development was driven by tighter international sanctions, redirection of trade flows and changes in statistical accounting. Given these structural factors, a more rapid recovery of re-exports is not expected in the near future. The development of exports of services is viewed more favourably: exports are growing steadily, are resilient to external shocks and there are no signs of a significant slowdown in growth as yet. A steady increase in the share of higher value-added exports such as financial, business and telecommunications services, is also encouraging.
Since overtaking exports of goods of Lithuanian origin for the first time at the end of 2025, exports of services have continued to grow.
Chart 9. Export components (at current prices; 4-quarter moving sums)
Sources: State Data Agency, Lietuvos bankas and Lietuvos bankas calculations
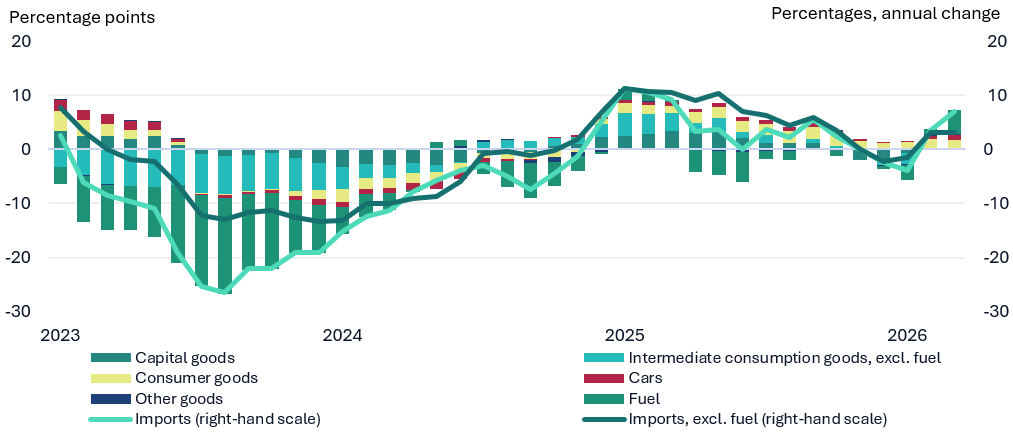
Nominal imports of goods began to rise again in the spring of 2026, with this recovery largely driven by increased fuel imports. The overall annual growth rate of imports, measured by a 3-month moving average, accelerated to around 7%. Fuel made the largest positive contribution to import growth, accounting for 4% of total import growth. Annual growth of imports excluding fuel stood at around 3.1%; consequently, more than half of the overall growth of imports can be attributed to the development of fuel imports, which was driven by soaring fuel prices in the spring of 2026 amid the geopolitical conflict in the Middle East. The growth of imports of capital goods suggests that corporate investment demand remained fairly resilient. However, the fact that imports excluding fuel grew at a significantly slower rate than total imports indicates that import growth driven by domestic demand remained moderate.
The recovery of imports in the spring of 2026 was driven mainly by fuel, while imports excluding fuel grew at a considerably slower pace.
Chart 10. Annual import growth (3-month moving average)
Sources: State Data Agency and Lietuvos bankas calculations.
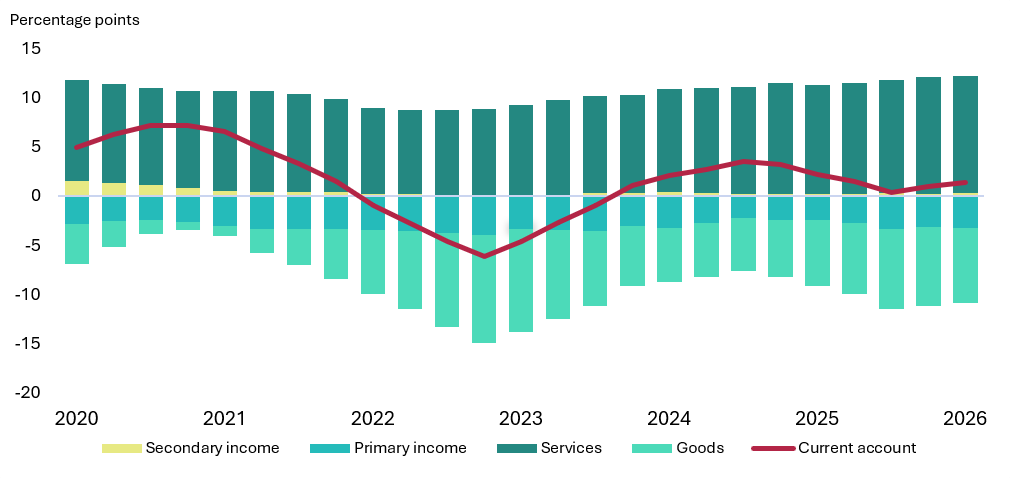
The current account balance remained positive at the start of 2026, while a substantial surplus on services continued to offset deficits on goods trade and primary income. The current account surplus, measured as a 4-quarter moving average, increased slightly in the first quarter of 2026 to 1.33% of GDP. The increase in the surplus largely reflected a slight improvement on the goods trade balance and a further increase in surplus on the balance of services. The services surplus stood at 11.9% of GDP at the start of 2026 and was the main factor underpinning the positive current account balance. The goods trade deficit narrowed slightly compared to the middle of 2025 and stood at around 7.6% of GDP. The balance of primary and secondary income remained largely unchanged.
Chart 11. Components of the current account and net borrowing (4-quarter moving averages, relative to GDP)
Sources: State Data Agency, Lietuvos bankas and Lietuvos bankas calculations
5.Prices
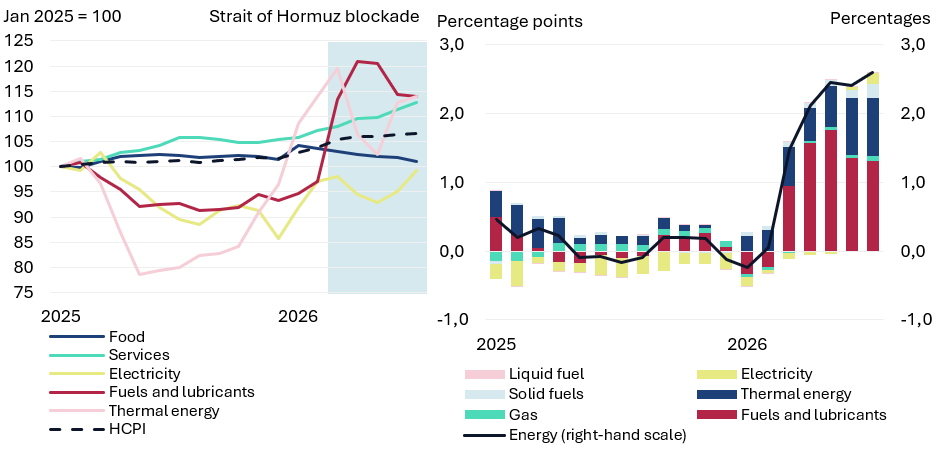
Average annual inflation in 2026 will rise significantly to 5.1% due to elevated energy costs.
Chart 12. Key price indices (left-hand panel), energy inflation and contributions (right-hand panel)
Sources: Eurostat, State Data Agency and Lietuvos bankas calculations.
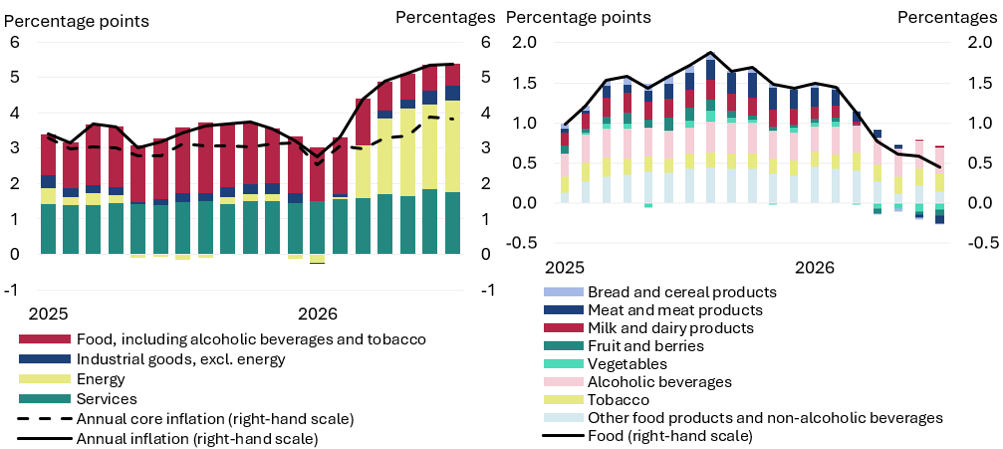
In 2026, prices of key food categories began to fall.
Chart 13. Headline food inflation and contributions (left-hand panel) and HICP inflation and contributions (right-hand panel)
Sources: Eurostat, State Data Agency and Lietuvos bankas calculations.
Services continue to be a key component driving HICP growth. This year, service prices are rising at an accelerated pace and have accounted for a stable share of headline inflation for several years now (see Chart 13, right-hand panel). Over the first seven months, the annual growth of service prices stood at 6.4%, up by 0.6 percentage points from 2025. This year has seen changes in the price dynamics of industrial products. Rising raw material and energy prices have led to higher production costs and a faster rise in annual inflation for these goods from 0.3% (February) to 1.1% (July).
Inflation is expected to continue to rise at a slower pace in 2027–2028: 3.1% and 2.6% respectively. However, there is considerable uncertainty surrounding price developments, largely owing to military action in the Persian Gulf. The pace at which the price growth in Lithuania subsides will depend on the duration of the conflict and normalisation of the global energy market. Despite the slowing growth of energy prices, domestic price pressures will continue to be driven by rigid pricing in the services sector and rising unit labour costs.
6.Monetary policy of the Eurosystem
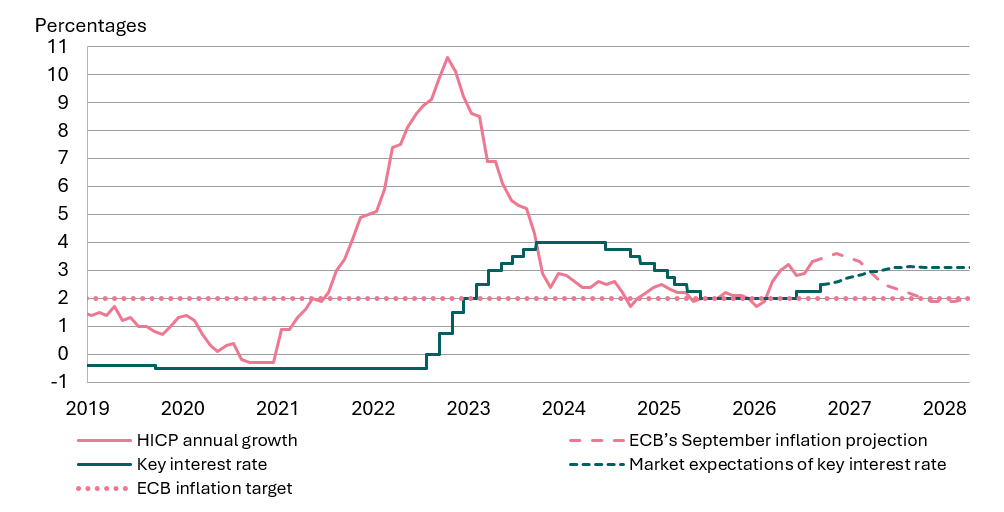
Higher energy prices have accelerated inflation not only in Lithuania but across the euro area as a whole. Following the outbreak of the war in the Middle East, energy prices soared, which in turn drove up the prices of other consumer goods and services. The risk of inflation remaining above the 2% target for a prolonged period has also increased.
In view of this, the Governing Council of the ECB began raising interest rates in the middle of the year; these rates had remained unchanged since June 2025. Exactly one year later – at its meeting in June 2026 – the Governing Council decided to raise key interest rates by 0.25 percentage points, and in September the rates were raised by the same margin once again. These decisions help to reduce the risk of de-anchoring of inflation expectations from the 2% target in the euro area. Inflation becomes most dangerous not when energy prices rise in a single month, but when consumers and businesses lose confidence that price growth of the basket of goods and services will return to normal levels. The Governing Council has repeatedly pointed out that future monetary policy decisions will depend on the inflation outlook, the dynamics of underlying inflation and the strength of the monetary policy transmission.
Projections suggest that tighter monetary policy will continue to weigh on inflation, and with energy prices no longer rising, inflation is expected to gradually return to the 2% target (see Chart 14). Although inflation in the euro area rose to 3.3% in August, the September macroeconomic projections state that, owing to the easing of the energy price shock and higher interest rates, inflation is expected to decline steadily every year, averaging 2.1% in 2028. Financial markets expect interest rates to rise slightly further over the course of the year. However, the Governing Council will continue to follow a data-dependent and meeting-by-meeting approach and its decisions will therefore not necessarily align with market participants' expectations.
The key ECB interest rates were raised to prevent inflation from deviating too far from the 2% target for too long.
Chart 14. Actual data on interest rates and inflation in the euro area and market expectations
Sources: ECB and LSEG Datastream.
Note: The Chart reflects the data as of 10 September.
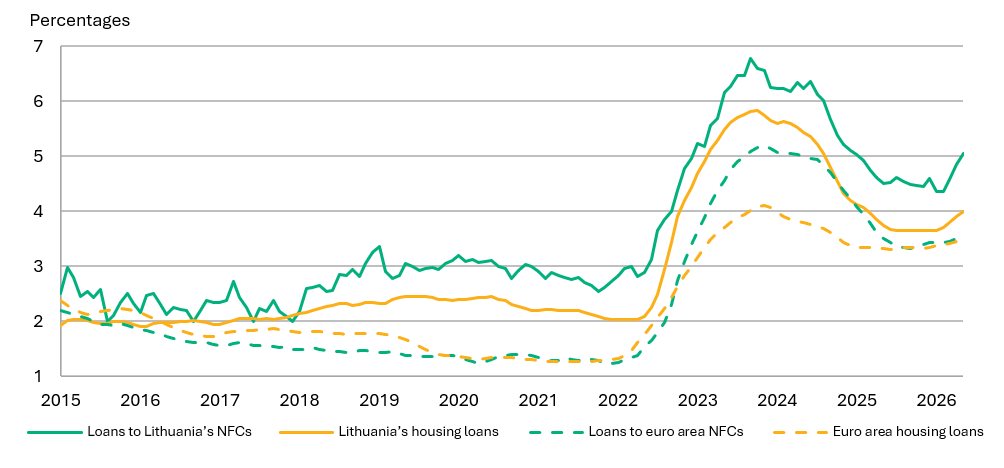
Lending rates rose as expectations of an ECB rate hike grew and remained higher in Lithuania than the euro area average (see Chart 15). Lending rates in Lithuania were higher than in the euro area even before the war in the Middle East, possibly reflecting greater concentration of the Lithuanian banking sector. Compared to February 2026, i.e. the level prior to the war in the Middle East, lending rates rose further and in Lithuania they grew faster than across the euro area. By June, interest rates on loans to non-financial corporations in Lithuania had risen by 0.7 percentage points, while those on housing loans by 0.3 percentage points. In the euro area, these changes amounted to 0.2 and 0.1 percentage points respectively. This difference may reflect the fact that the majority of loans in Lithuania are granted at variable interest rates, meaning that changes in ECB interest rates and related expectations have an immediate impact on lending rates in Lithuania, whereas the impact on fixed-rate loans in the euro area is felt only when the level of long-term interest rates changes.
Lending rates have begun to rise both in the euro area and Lithuania.
Chart 15. Average interest rates on new MFI housing loans and loans to NFCs
Sources: ECB and Lietuvos bankas calculations.
Notes: 3-month moving average. Excluding revolving loans and overdrafts.
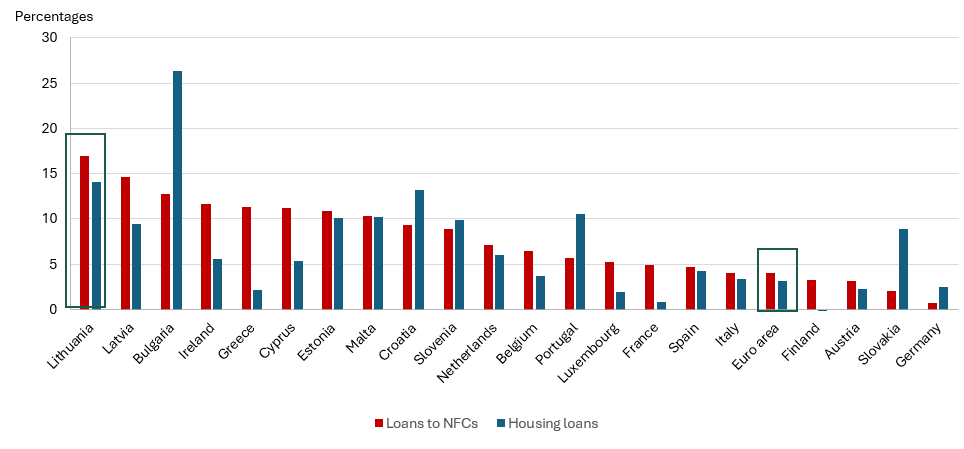
Lending in Lithuania was among the fastest-growing in the euro area.
Chart 16. Annual change in MFI loans to NFCs and housing loan portfolio in the euro area countries, June 2026
Source: ECB.
7.General government finance
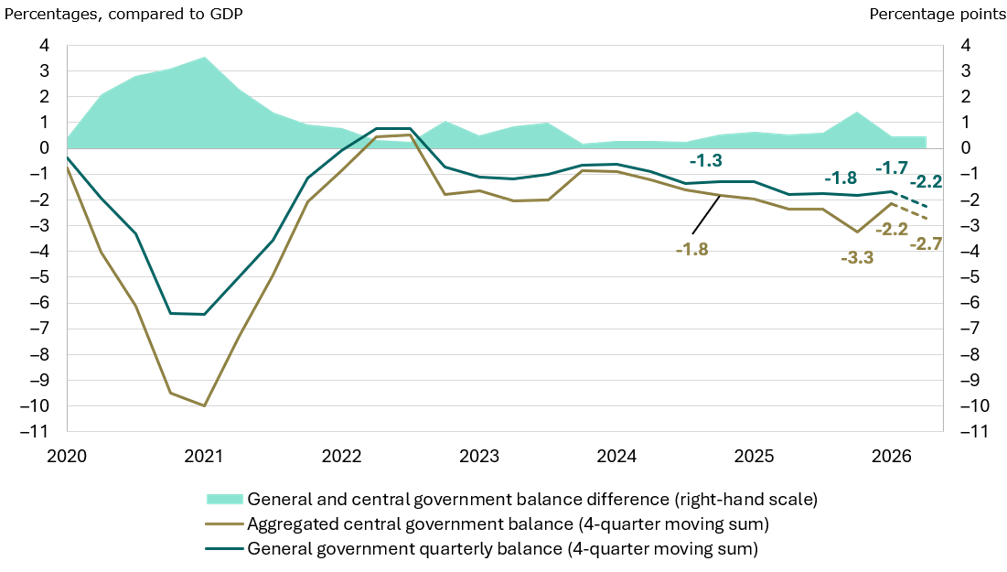
In the second half of 2026, the general government deficit widened and reached its highest level since the third quarter of 2021.
Chart 17. General government and central government balance development (4-quarter moving sums)
Sources: State Data Agency and Lietuvos bankas calculations.
Note: Dashed lines indicate the estimates of corresponding indicators calculated by Lietuvos bankas.
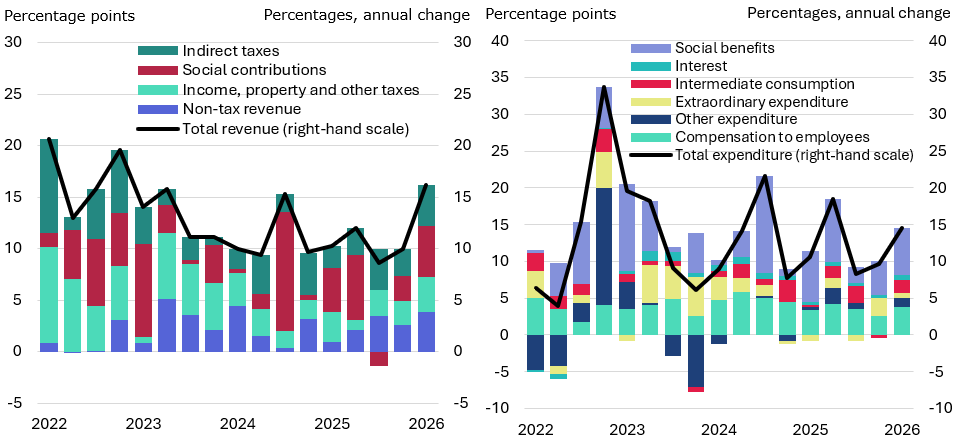
General government revenue continued to grow in the first and second quarters of 2026 (by 16.2% and, likely, around 10% respectively) (see Chart 18, left-hand panel). In the second half of 2026, tax revenue was the main driver of growth of general government revenue. Tax revenue grew mainly on account of increases in the macroeconomic aggregates underlying the respective tax bases: a higher wage bill boosted personal income tax revenue, while rising consumption increased VAT and excise duty revenue. It should be noted that, despite higher fuel prices triggered by the war in Iran and much elevated oil prices, the sales dynamics for individual fuel types on the domestic market differed considerably: the volume of petrol sold in the first and second quarters was higher than a year ago, but the volume of diesel increased only in the first quarter. In the second quarter, sales of diesel subject to the standard excise duty were almost a tenth lower than a year ago. Despite these differences, revenue from excise duties on fuel in the first half of the year was approximately 6% higher than a year ago, as higher excise duty rates offset the negative impact of lower volumes on revenue. The strong positive impact of social contributions on the general government revenue can be attributed to a low base effect, with the social contribution receipts being relatively low in the first quarter of 2025 owing to the statistical treatment of persons insured by the state, whereas the quarterly flows of these contributions were considerably more even in 2026.
The annual growth of general government spending was also rapid in the first quarter of 2026 (14.5%) and likely to have slowed slightly in the second quarter (see Chart 18, right-hand panel). In the first quarter, the growth of general government expenditure was mainly driven by higher social benefits, while rising wage costs also made a significant contribution. The growth of social benefits largely reflected the increase in the base pension and value of individual pension accounting points at the beginning of the year as well as higher values of the MMW and other indicators (minimum consumption needs, basic social benefits, etc.) used to calculate various social benefits. As in previous quarters, expenditure on wages and salaries continued to be driven mostly by wage costs for employees in the education and health sectors.
In the first half of 2026, the general government revenue and expenditure rose rapidly: revenue was driven mainly by social contributions and tax revenue, while expenditure was driven by social benefits and staff salaries.
Chart 18. Annual developments in general government revenue (left-hand panel) and expenditure (right-hand panel) and contributions to these changes
Sources: State Data Agency and Lietuvos bankas calculations.
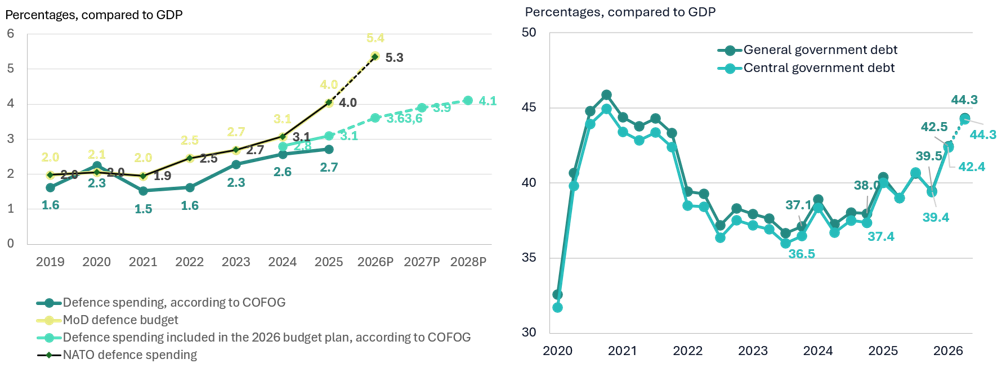
In the first half of 2026, the general government debt-to-GDP ratio rose significantly but is expected to stabilise in the second half of the year at around the current level. In the first and second quarters of 2026, the general government debt-to-GDP ratio rose to 42.5% and 44.3% respectively due to positive net borrowing (see Chart 19, right-hand panel). Soaring debt was mainly driven by significant positive net borrowing: according to the Lithuanian Government’s borrowing and debt repayment statistics published by the Ministry of Finance, funds borrowed in the first half of 2026 were roughly €5.6 billion higher than the amounts repaid. In addition to the need to finance the accumulating general government balance deficit, the level of debt was also significantly increased by growing defence commitments financed through advance payments, although all defence expenditure will only be included in the general government balance sheet in the future. Borrowing to finance defence needs is likely to continue in the second half of the year, but the planned redemption of a large bond issue for this purpose – most likely using funds already borrowed – should result in a slightly lower debt-to-GDP ratio in the second half of the year.
The increase in defence funding in the first quarter of 2026 has not yet led to a significant rise in general government expenditure (due to a time lag resulting from accounting principles); however, borrowing to cover the accumulating general government balance deficit and advance payments related to defence projects has increased the general government debt-to-GDP ratio, which is unlikely to change significantly in the second half of the year.
Chart 19. Defence expenditure developments (left-hand panel) and general government debt-to-GDP ratio and projection for the coming quarter (right-hand panel)
Sources: State Data Agency, Ministry of Defence and Lietuvos bankas calculations.
Prepared by Kasparas Vasiliauskas
The public finance system is used to redistribute resources across different stages of a person’s life. During childhood and in old age, people generally receive much more public services and benefits than they pay in taxes and contributions at that time, while during their working years the opposite is usually true. Thus, a person’s interaction with public finance changes over the course of their life cycle. Once they reach adulthood and enter the labour market, people effectively repay, through taxes and contributions, the public services they received in childhood by financing such services for the younger generation. At the same time, they contribute to the welfare of the elderly, the generation that previously financed the welfare of today’s working population during their childhood. By paying taxes and contributions, people of working age also accrue social entitlements from which they will increasingly benefit later in life. This creates a kind of social contract between generations, whereby, over the course of a person’s life, they move from being a beneficiary of public finance to a contributor and later become a beneficiary once again.
The redistribution of resources across different stages of a person’s life and the social contract between generations operate in practice through redistribution of resources among different age groups at a given point time. During a given period, one age group contributes more to public finance than it receives, while others receive more than contribute. Therefore, what matters for public finance is not only how much people of different ages pay and receive, but also how many people there are in each age group. In other words, the age structure of the population is important. If the number of people who pay more than they receive decreases, while the number of those who receive more than they pay increases, the state of public finances deteriorates even if the system of taxes, benefits and public service provision remains unchanged. Against this background, the box first calculates how much Lithuanians in different age groups pay in taxes and contributions and how much they receive in public services and benefits. It then assesses how the state of public finance would change by 2050 if the ratio of taxes paid and benefits and public services received for each age group were to remain the same as in 2024, while the age structure of the population were to change in line with official demographic projections.
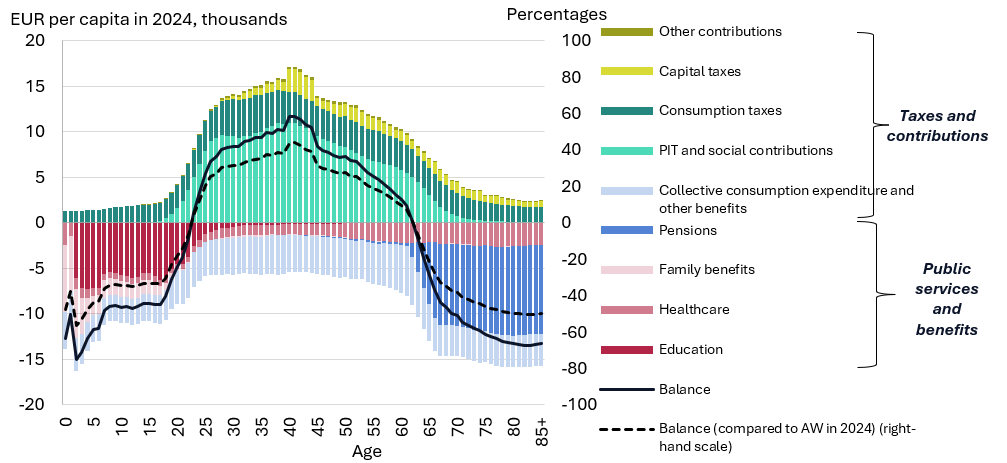
During a person’s working life, their contribution to public finance begins to exceed the public services and benefits they receive. The average balance between taxes and contributions paid and public services and benefits received becomes positive from around the age of 23, when the majority of people complete their general and higher education and enter the labour market. As labour income rises, so do the levels of personal income tax and social contributions paid. Some people set up businesses or invest, thereby generating capital income, which in turn leads to an increase in capital taxes paid. Consumption rises in line with income, and with it, consumption taxes (VAT and excise duties). The largest budget surplus is reached at the age of 40–45. In 2024, it stood at approximately €11,000 per capita per year, or slightly more than 40% of the annual average wage. Thereafter, this surplus decreases steadily, and around the age of 63 the balance turns negative again, as an increasing share of the population leaves the labour market.
The greatest benefits of public services and public finance are derived in early childhood and late old age when people are least able to work.
Chart A. Fiscal balances per capita for different age groups
Sources: Eurostat, State Data Agency and Lietuvos bankas calculations.
Over the course of a person’s lifetime, they receive, on average, slightly more from public finance than they pay. The difference is particularly large during childhood and youth: the ratio of public services and benefits received to taxes and contributions paid exceeds ten, as children receive education and healthcare services as well as various benefits related to their birth and upbringing (see Chart B). Once a person starts working, this ratio drops sharply and by around the age of 50 the total amount of taxes and contributions paid up to that point for the first time exceeds the value of the benefits and public services received. The gap continues to widen, becoming the widest at around the age of 60, by which time a person has already paid approximately 10% more than they have received. Later, the trend reverses: once a person starts receiving a pension, the value of benefits received from public finance begins to rise steeply and at around the age of 73 their total value once again exceeds the amount of taxes and contributions paid up to that point. Ultimately, the ratio of public services and benefits received over a lifetime to the taxes and contributions paid exceeds 1, which means that, on average, a person receives more than they pay.
Over the course of a person’s lifetime, they receive slightly more from public finance than they contribute.
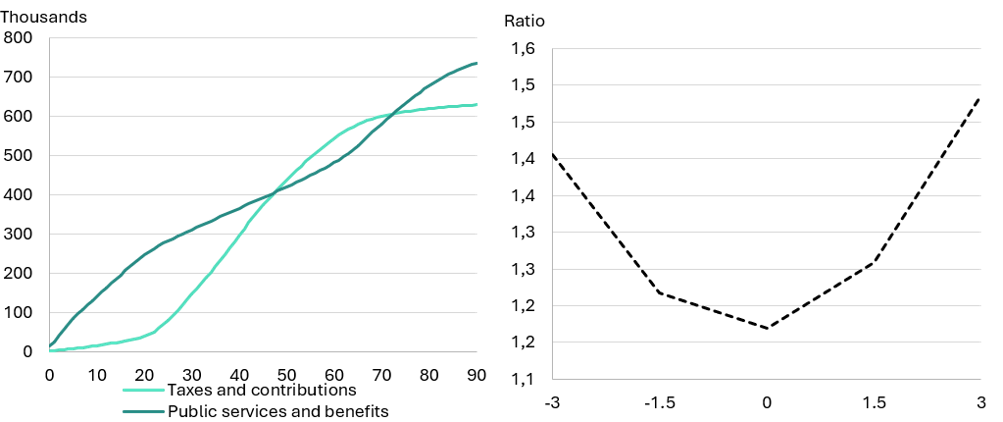
Sources: Eurostat, State Data Agency and Lietuvos bankas calculations.
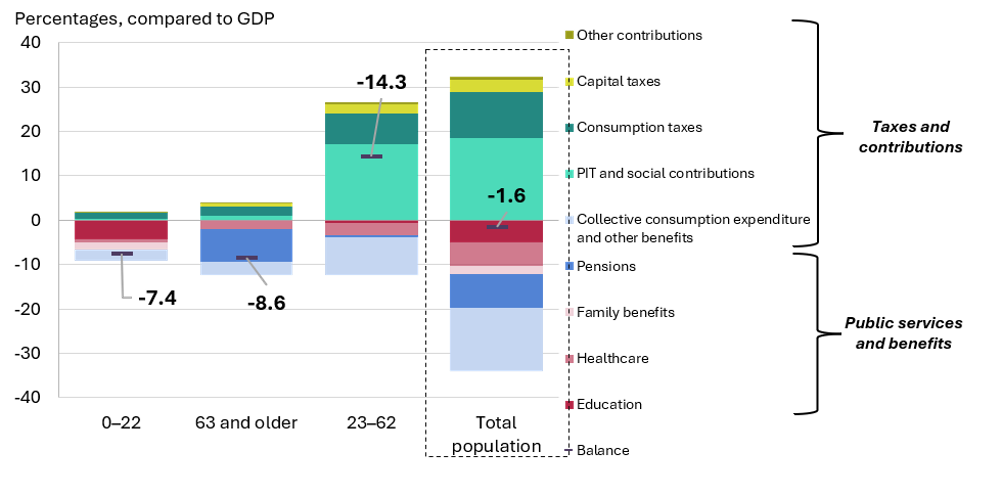
Moving from the individual level to the overall level of public finance, it is clear that the taxes and contributions paid by people of working age in 2024 are insufficient to cover the liabilities towards younger and older age groups. By linking the balances of taxes and contributions paid and public services and benefits received by each age group with the number of people of the relevant age group, it is possible to assess each group’s overall contribution to public finance (see Chart C). In 2024, the population aged 23–62 constituted the largest segment of society: approximately 1.57 million, or 55% of the total population. The taxes and contributions they paid amounted to more than 26% of GDP, while the benefits and public services they received amounted to slightly more than 12% of GDP. Thus, the surplus generated by this group amounted to around 14% of GDP. However, the combined negative balance for children and adolescents (aged 0–22) and the older population (aged 63 and over) stood at around 16% of GDP, which is 2 percentage points higher than the surplus generated by the working-age population.
The fiscal contribution of the working-age population is insufficient to cover the liabilities to younger and older age groups.
Chart C. Impact of fiscal balances of different age groups on public finances in 2024
Sources: Eurostat and Lietuvos bankas calculations.
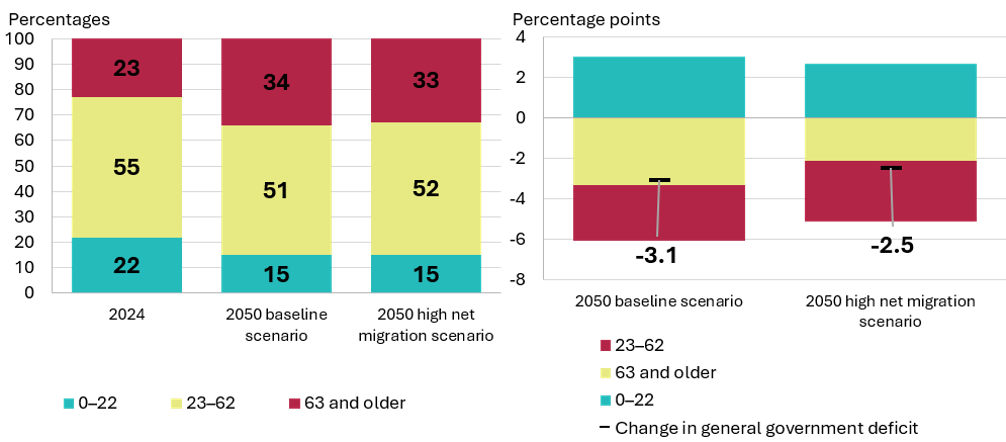
The declining number of younger and working-age people, coupled with a growing older generation, will have contrasting effects on public finances. Fewer children and teenagers will reduce expenditure on education and family benefits, thereby improving the balance of public finance. However, this effect will be more than offset by the declining number of working-age people paying taxes and contributions and by rising expenditure for the elderly. If the age-specific balances of taxes and contributions as well as public services and benefits remained unchanged at the level of 2024 and tax and social policies in Lithuania also remained unchanged, demographic changes alone would worsen the public finance balance by around 3.1 percentage points of GDP by 2050 (see Chart D, right-hand panel). Higher net migration would reduce this deterioration by approximately 0.6 percentage points, mainly due to a larger working-age population.
As a result of the population ageing, the general government deficit would more than double.
Chart D. Age structure of the population in 2050 (left-hand panel) and increase in the general government deficit in 2050 compared to 2024 (right-hand panel)
Sources: Eurostat and Lietuvos bankas calculations.
Population ageing will undoubtedly worsen the financial condition of Lithuania’s public sector and, in the longer term, increase the risks to the sustainability of public finance. Already, the taxes and contributions paid by the working-age population are insufficient to cover existing liabilities to younger and older age groups, and this gap will widen as the population ages. This box assesses specifically the impact of the population age structure, excluding the effect of other factors such as fertility rates, labour productivity, economic growth or fiscal policy developments. Therefore, the actual development of public finance may differ, but the direction of population ageing and its negative impact on public finance remain clear. There are various possible solutions to mitigate the impact of population ageing on public finance. Some would reduce or defer the required expenditure associated with demographic changes, for instance, longer labour market participation and later retirement or an education network adapted to a declining number of children. Others would strengthen the revenue base of public finance by increasing the contribution of the working-age population, broadening the tax base to include income from different sources or accelerating growth of labour productivity and, consequently, income. As these measures would affect different age groups to varying degrees, combining them would allow the burden of adjustment to be distributed more evenly and help to strengthen the sustainability of public finance.
Abbreviations
GDP gross domestic product
CG central government
AI artificial intelligence
OECD Organisation for Economic Cooperation and Development
ECB European Central Bank
EC European Commission
EU European Union
Eurosystem European Central Bank and euro area central banks
IT information technology
USA/US United States of America
MoD Ministry of Defence
MMW minimum monthly wage
R&D research and development
NEER nominal effective exchange rate
RE real estate
CIS Commonwealth of Independent States
MFI monetary financial institution
PPP purchasing power parity
PPS purchasing power standard
VAT value added tax
HICP Harmonised Index of Consumer Prices
IMF International Monetary Fund
SDA State Data Agency
AW average wage
GG general government
Sodra State Social Insurance Fund
|
© Lietuvos bankas, 2026 Gedimino pr. 6, LT-01103 Vilnius The Lithuanian Economic Review analyses the developments of the real sector, prices, public finance and credit in Lithuania, as well as the projected development of the domestic economy. The material presented in this review is the result of statistical data analysis, modelling and expert assessment. The review is prepared by Lietuvos bankas. The cut-off date for the data used in the publication is 1 September 2026, except for information on monetary policy decisions. Reproduction for educational and non-commercial purposes is permitted provided that the source is acknowledged. ISSN 2029-8471 (online) |