
Lithuania’s economic development and outlook
2 April 2026
At the beginning of the year, global economic developments were more favourable than expected, but events in the international environment caused greater uncertainty. At the end of last year, global economic growth remained resilient – the adverse effects of trade policy changes and ongoing policy uncertainty were offset by rapidly increasing investment in technology, including artificial intelligence, and looser fiscal and monetary policies. Faster economic growth also led to more intense international trade flows, which had a positive impact on manufacturing indicators in many countries. Higher-frequency data indicated that favourable global economic trends were expected to continue into early 2026. In February, prior to the events in the Middle East, the global Purchasing Managers’ Index (PMI) reached its highest level in the past 21 months, indicating growth in activity across most major economies. Other indicators also pointed to favourable trends – business expectations regarding future production reached their highest level in nearly six months; there was also an increase in new export orders. However, the conflict in the Middle East has significantly increased uncertainty as to whether this positive trend in global economic growth will persist and how seriously it will be affected. One of the most important factors that could influence both the global economy and Lithuanian economy is the supply and prices of energy resources.
The Lithuanian economy closed last year with substantial growth. In 2025, the real gross domestic product (GDP) grew by 2.9%, showing only a slightly slower growth rate than in 2024. It should be noted that by the end of the year, economic activity had nearly reached a long-term growth trend, demonstrating the ability of the economy to adapt to the latest shocks. Last year, value added increased in nearly all economic activities. The key contributors to economic growth were trade and transportation, manufacturing, information and communication, as well as professional services. Activity in these economic sectors was driven by both foreign and domestic demand. Last year, demand for goods and services increased in the key trading partners by about 4%, i.e.at a similar pace as in the decade preceding the COVID-19 pandemic (2011–2019). However, part of this rebound is linked to business efforts in the first months of the year to rush transactions ahead of a potential increase in customs tariffs, while in the second half of the year foreign demand grew more sluggishly. Domestic demand showed mixed trends: household consumption grew more slowly, while investment expenditure, which had previously fallen, increased last year. Household consumption was most constrained by rising inflation and a temporary decline in consumer sentiment. Spending on non-durable goods and services grew noticeably slower than a year ago. Although the consumer confidence is still above the long-term average, consumer expectations regarding the country’s economic situation and unemployment have become more cautious. Meanwhile, after the difficult year 2024, investment rebounded rapidly primarily due to increased spending on means of production, while investment in non-residential buildings and structures also slightly rose. Investment grew in both the private sector and public sector. Investment facilitated rise in labour productivity, which significantly contributed to economic growth. Labour productivity growth has picked up and once again is approaching a long-term growth trend.
The situation in the labour market remains favourable for workers, but demographic trends create tensions. In 2025, wages continued to rise noticeably faster than prices, but the pace of growth slowed and stood at 8.4%. This is the smallest wage increase in nearly a decade. Wage trends are affected by changing corporate financial capacities – the labour share in 2025 was the highest since the beginning of publication of data. Nevertheless, further wage growth is supported by strong labour demand – in most economic activities the vacancy rate exceeds the long-term average. The strong demand for labour is also reflected in the unemployment rate, which was below 7.0% in 2025. Changing demographic trends also put pressure on labour demand. After several years of growth, the labour force – the number of the employed and job seekers – did not increase last year. This is linked to lower net international migration, halted growth of the working-age population and a stopped increase in labour force participation rate. Such labour force trends also affect the number of the employed, which last year declined for the first time since 2021.
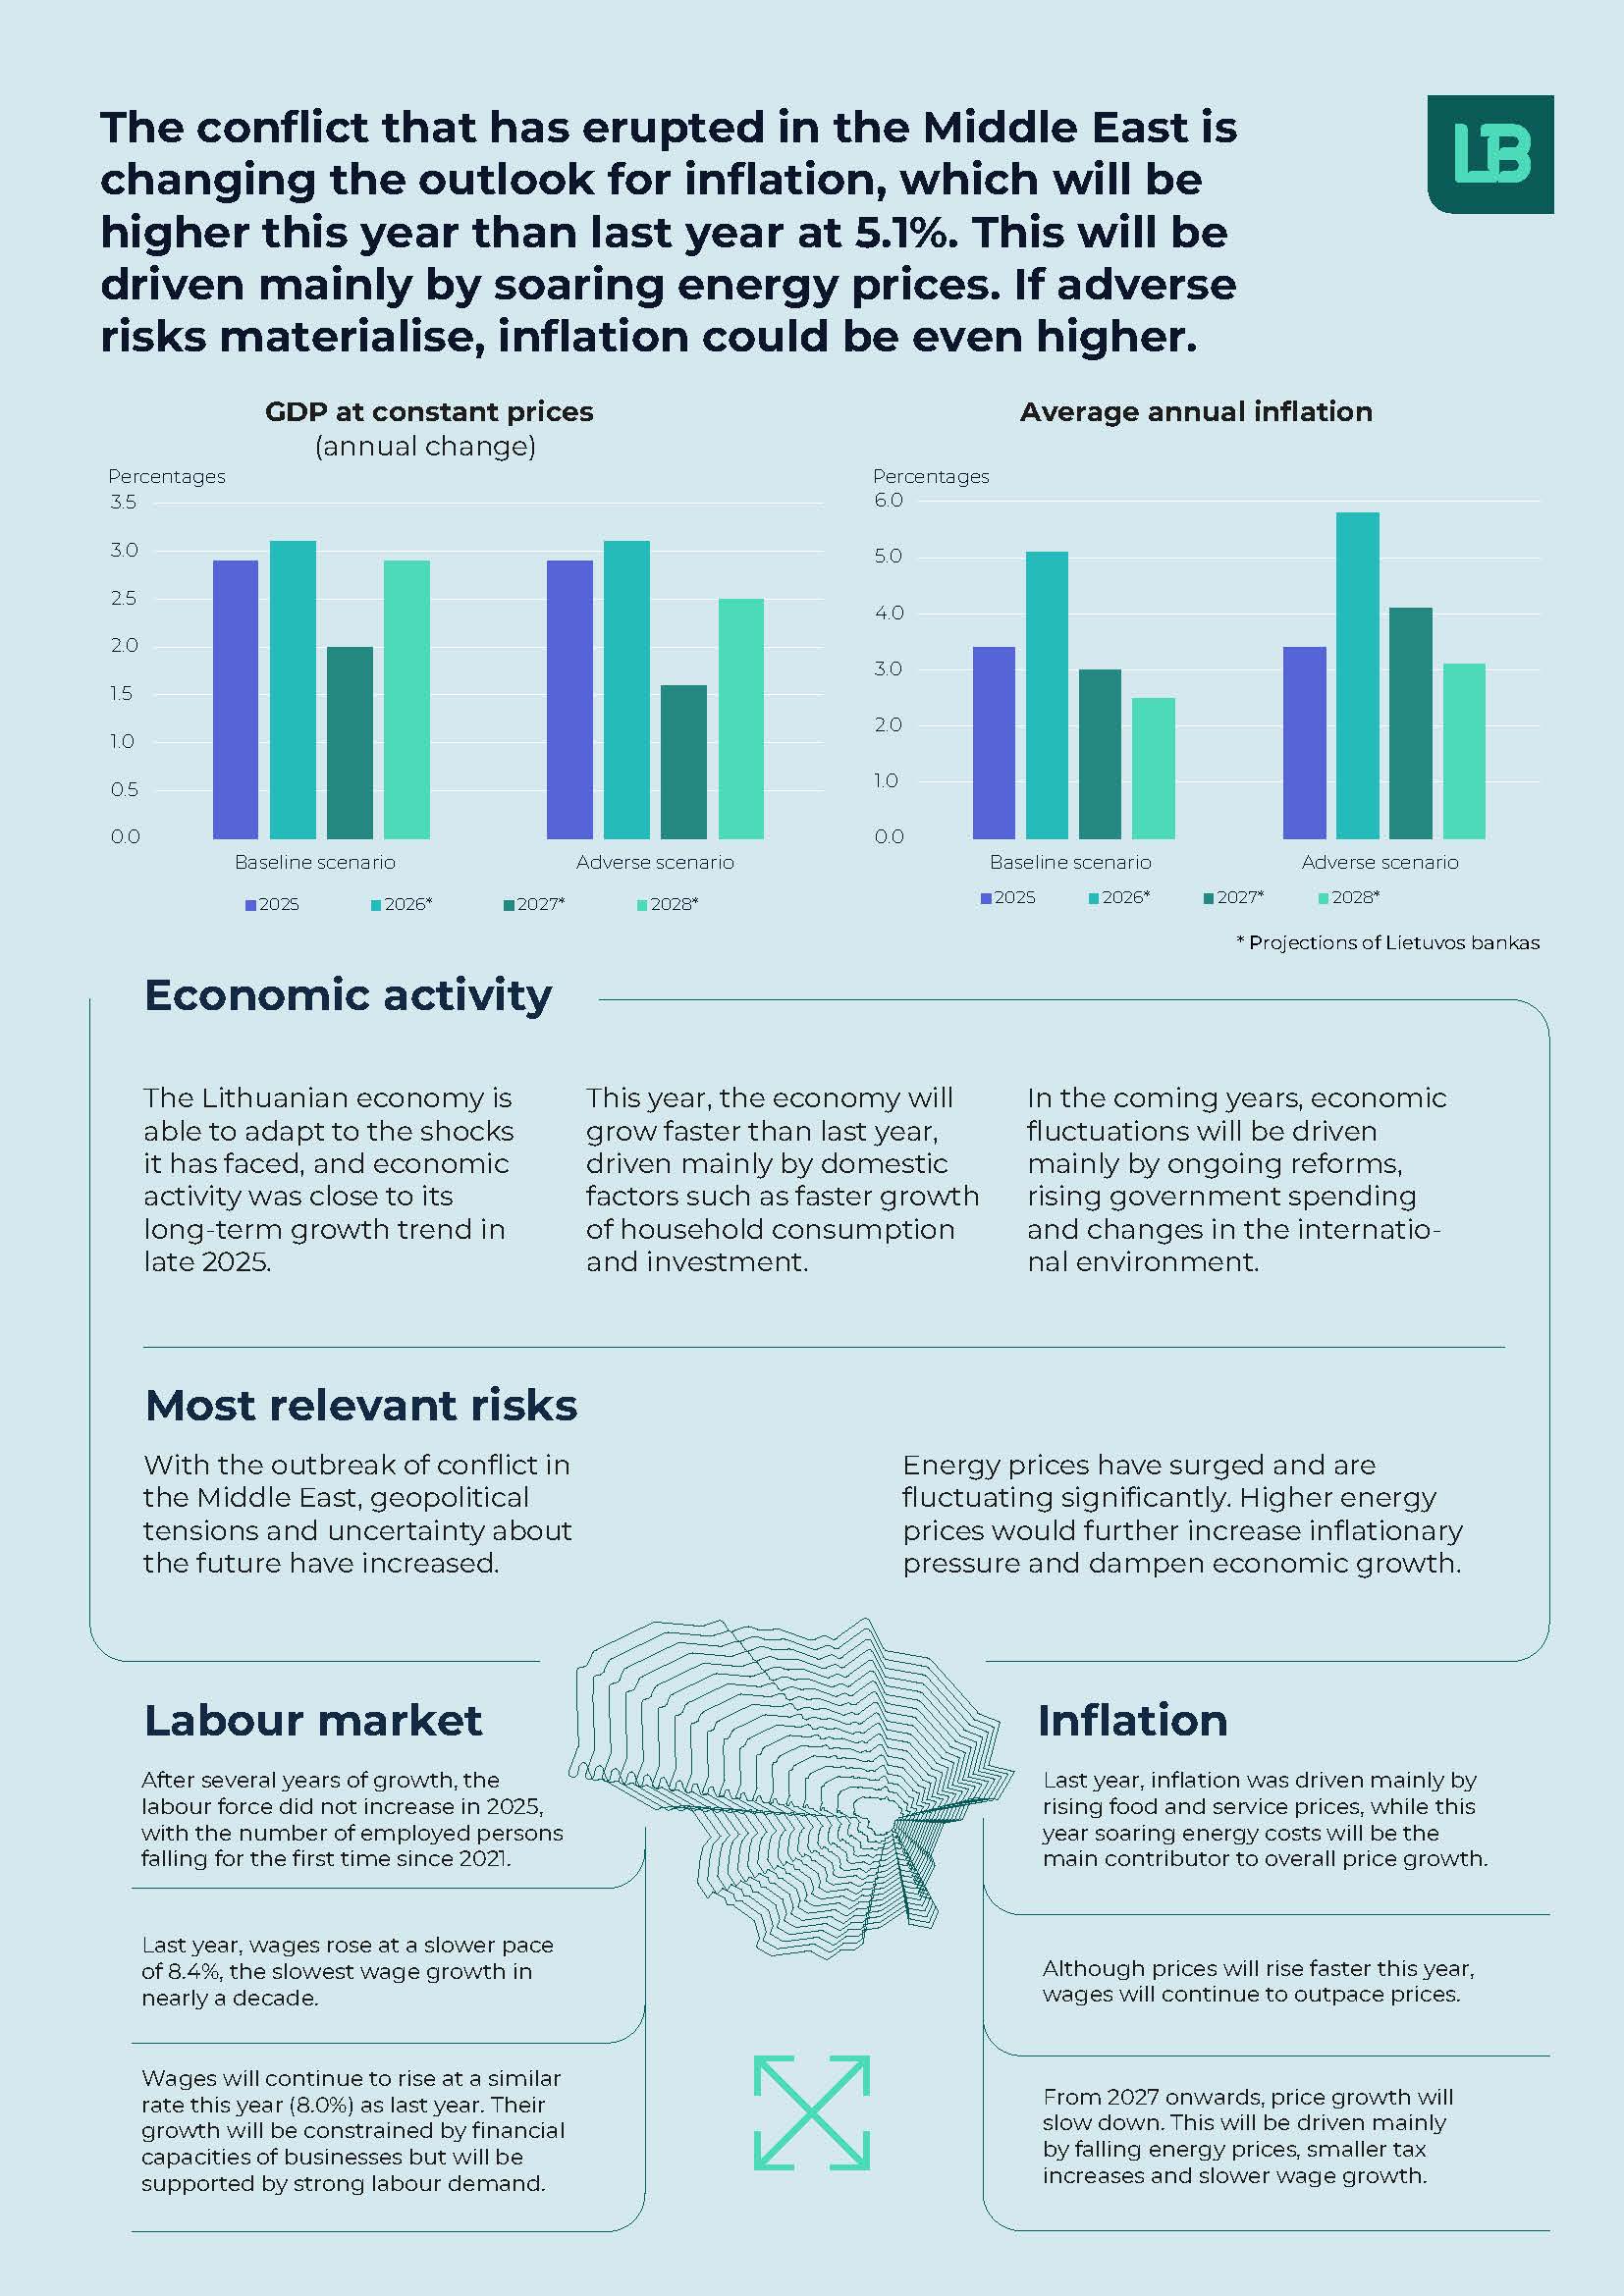
In the coming years, economic fluctuations will be significantly affected by ongoing reforms, rising general government expenditure and developments in the international environment. According to the baseline scenario, Lithuania’s real GDP is projected to grow by 3.1% this year, and by 2.0% and 2.9% in 2027–2028 respectively. These fluctuations in activity will be most influenced by the newly available possibility of withdrawing funds from the second-pillar pension accumulation funds (SPPAF), which will increase the disposable funds of the population. This year, households are projected to spend a significant portion of the withdrawn funds on goods and services, accelerating economic growth. By 2027, the positive impact of the funds previously withdrawn from the SPPAF is expected to fade, and economic growth is projected to slow at that time. In subsequent years, economic growth will return to a more normal trajectory, and any further withdrawals from the SPPAF will have only a limited impact. This year, the growth will also be more strongly driven by a significant increase in certain general government expenditure, specifically investments related to defence needs, as well as other investments. Unlike the factors mentioned above, foreign demand, which rose significantly last year partly due to intensified stockpiling ahead of the implementation of higher custom tariffs, is projected to grow at a slower pace in 2026, thus limiting export growth. Notably, according to the baseline scenario it is assumed that the impact of events in the Middle East on Lithuania’s foreign demand will not be significant, and that the surge in energy prices will be relatively short-lived. The impact of these factors on Lithuanian economic activity is therefore expected to be fairly limited.
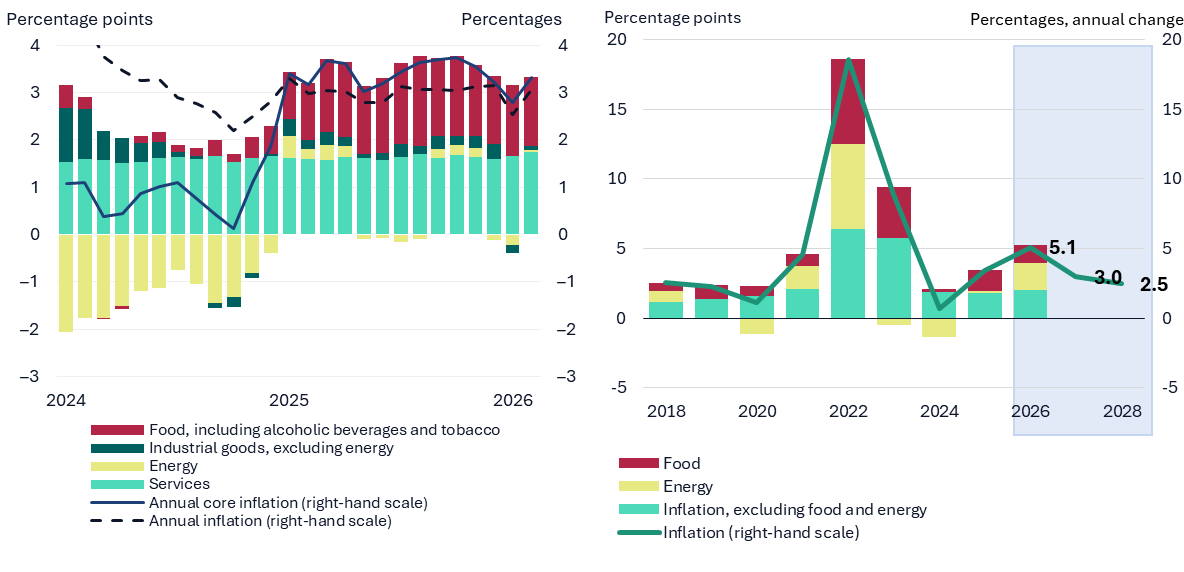
The conflict that has erupted in the Middle East is changing the outlook for inflation; this year it will be higher than last year, with higher energy prices being the main factor. Annual inflation, which had been falling steadily, reaching 2.8% January, is rising again. It is projected to remain on an upward trend in the coming months and amount on average 5.1% this year. The increase in inflation will be driven primarily by energy prices, which are dictated by a significant rise in the cost of energy resources. At the beginning of the year, electricity and gas prices increased due to greater demand caused by a cold winter, but now the main factor behind the surge in prices of energy resources is the conflict in the Middle East. Higher energy costs will also have impact on the prices of other goods and services. Regardless of the increase in energy costs, food prices, including prices of alcoholic beverages and tobacco, will rise more slowly this year, as the supply of food commodities has begun to normalise in recent months. Overall, this year average annual inflation will be significantly driven by indirect taxes increased in January, which will account for about one-fifth of average annual inflation. The withdrawal of funds from the SPPAF will also contribute to the overall rise in prices; it will stimulate economic activity and, as a result, demand-driven inflation. In the following years, average annual inflation will decline, reaching 3.0% in 2027 and 2.5% in 2028, mainly due to falling energy prices, lower tax increases and slower growth of wages.
However, the future course of events in the Middle East is surrounded by significant uncertainty; an escalation of the conflict could affect Lithuania’s economic development more than projected in the baseline scenario. According to the latter scenario, disruptions in energy supply are assumed to continue until the third quarter of 2026. It is also assumed that there will be no additional major damage to the infrastructure of extraction and supply of energy resources. According to the adverse scenario, disruptions in energy supply are assumed to continue until the fourth quarter of 2026, while the infrastructure of extraction and supply of energy resources is assumed to suffer significant additional damage. If the case of the events projected in this scenario, prices in Lithuania would rise more, and the economic activity would be more affected: in 2026–2028, inflation in Lithuania would be cumulatively 2.3 percentage points higher than projected in the baseline scenario, while the real GDP growth would be cumulatively 0.8 percentage points lower.
Outlook for Lithuania’s economy
|
April 2026 projectiona |
December 2025 projection |
|||||||
|
2025b |
2026b |
2027b |
2028b |
2025b |
2026b |
2027b |
2028b |
|
|
Price and cost developments (annual percentage change) |
||||||||
|
Average annual HICP inflatione |
3.4 |
5.1 |
3.0 |
2.5 |
3.5 |
3.1 |
2.6 |
2.5 |
|
GDP deflatorc |
3.4 |
3.6 |
3.3 |
3.3 |
3.9 |
3.4 |
2.9 |
3.1 |
|
Wages |
8.4 |
8.0 |
6.8 |
7.3 |
8.4 |
9.1 |
6.9 |
7.5 |
|
Import deflatorc |
-1.6 |
3.3 |
2.6 |
1.0 |
-0.5 |
1.5 |
2.1 |
2.0 |
|
Export deflatorc |
-0.1 |
2.0 |
2.1 |
2.1 |
0.2 |
2.2 |
2.1 |
2.1 |
|
Economic activity (constant prices; annual percentage change) |
||||||||
|
GDPc |
2.9 |
3.1 |
2.0 |
2.9 |
2.5 |
3.2 |
2.3 |
3.0 |
|
Private consumption expenditurec |
1.9 |
3.8 |
0.3 |
4.7 |
2.0 |
5.0 |
0.4 |
4.8 |
|
General government consumption expenditurec |
1.5 |
0.5 |
0.4 |
0.4 |
1.3 |
0.3 |
0.1 |
0.1 |
|
Gross fixed capital formationc |
7.1 |
11.7 |
3.0 |
3.7 |
6.5 |
11.5 |
3.6 |
4.1 |
|
Exports of goods and servicesc |
4.2 |
2.0 |
3.1 |
3.4 |
4.3 |
2.3 |
3.3 |
3.3 |
|
Imports of goods and servicesc |
8.5 |
5.4 |
2.0 |
4.5 |
7.9 |
6.2 |
2.2 |
4.5 |
|
Labour market |
||||||||
|
Unemployment rate (annual average as a percentage of labour force) |
6.9 |
6.7 |
6.6 |
6.6 |
7.0 |
6.6 |
6.5 |
6.5 |
|
Employment (%, annual percentage change)d |
-0.5 |
0.0 |
-0.2 |
-0.3 |
0.0 |
0.2 |
-0.2 |
-0.3 |
|
External sector (percentage of GDP) |
||||||||
|
Balance of goods and services |
3.7 |
0.4 |
0.8 |
0.8 |
3.5 |
1.4 |
2.2 |
1.4 |
|
Current account balance |
0.9 |
-2.8 |
-2.6 |
-2.7 |
0.1 |
-1.8 |
-1.2 |
-2.1 |
|
Current and capital account balance |
2.8 |
-0.6 |
-1.5 |
-2.0 |
1.6 |
0.4 |
-0.1 |
-1.4 |
a The macroeconomic projections are based on external assumptions, constructed using information made available by 11 March 2026, and other data and information made available by 11 March 2026.
b Projection.
c Adjusted for seasonal and workday effects.
d National accounts data; employment in domestic concept.
e Harmonised Index of Consumer Prices.
1.International environment
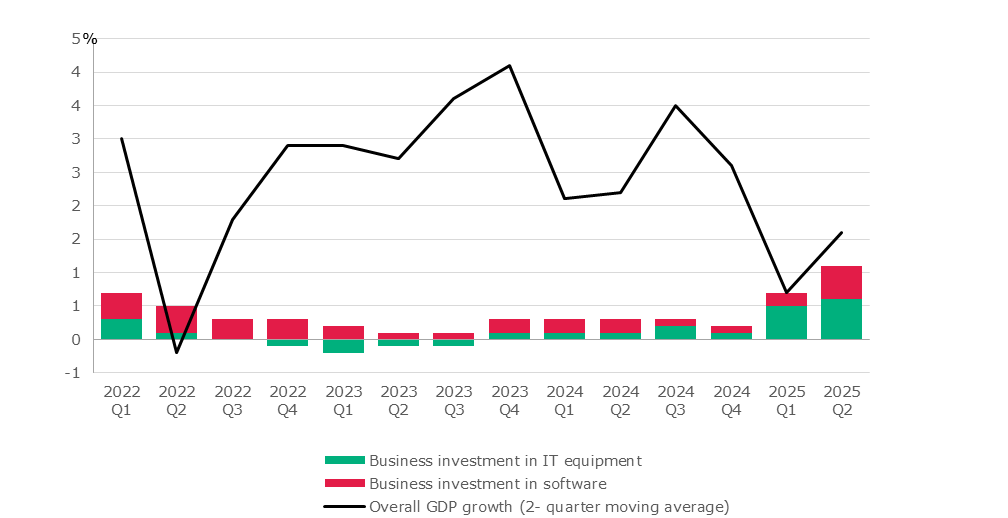
IT investment accounted for more than half of the 1.6% annual growth rate of the US GDP in the first half of 2025.
Chart 1. Contribution of business investment in IT and software to US GDP growth
Source: Bloomberg.
Prepared by Ernestas Virbickas
In 2025, the euro appreciated against the US dollar. This shift in the exchange rate partly reflected the weaker outlook for the US economy and a more cautious assessment of the risk level of US financial assets amid elevated uncertainty about the country’s economic policy. The US dollar weakened most significantly in the first half of last year (see Chart A, panel a), following announcements by the relevant US authorities regarding higher international trade tariffs and the possibility of further increases. In 2025, from its lows in mid-January to its highs in mid-September the euro appreciated by 16.1% against the US dollar and its average exchange rate in 2025 was 4.4% stronger than in the previous year. The euro also strengthened against the Chinese yuan as the latter’s exchange rate movements typically track those of the US dollar. The nominal effective exchange rate (NEER) of the euro, calculated using euro area trade weights, was 4.6% stronger in 2025 than a year earlier (see Chart A, panel b). The euro NEER, calculated using Lithuania’s trade weights, strengthened by a smaller margin (1.0%) during this period, partly due to less intensive trade with countries such as the USA and China. From a historical perspective, this was not an exceptionally large change in the euro exchange rate.
In 2025, the euro appreciated by 4.4% against the US dollar
Chart A. Euro exchange rate
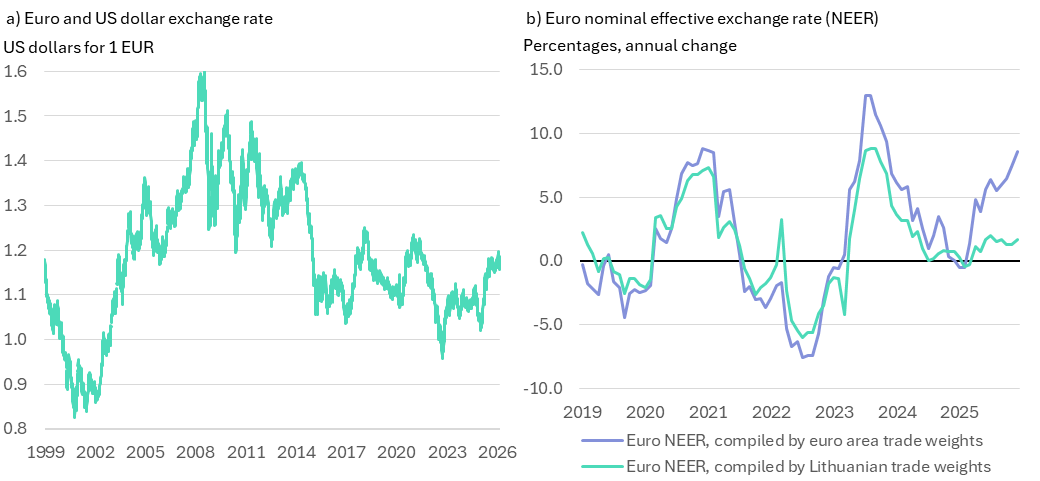
Sources: ECB and Lietuvos bankas calculations.
Note: The euro NEER is based on the data of trade with 42 countries.
Euro is the dominant currency for export payments. This mitigates the adverse impact of the euro’s appreciation on economic activity in the short term.
Chart B. Export and import shares settled in euro in 2024
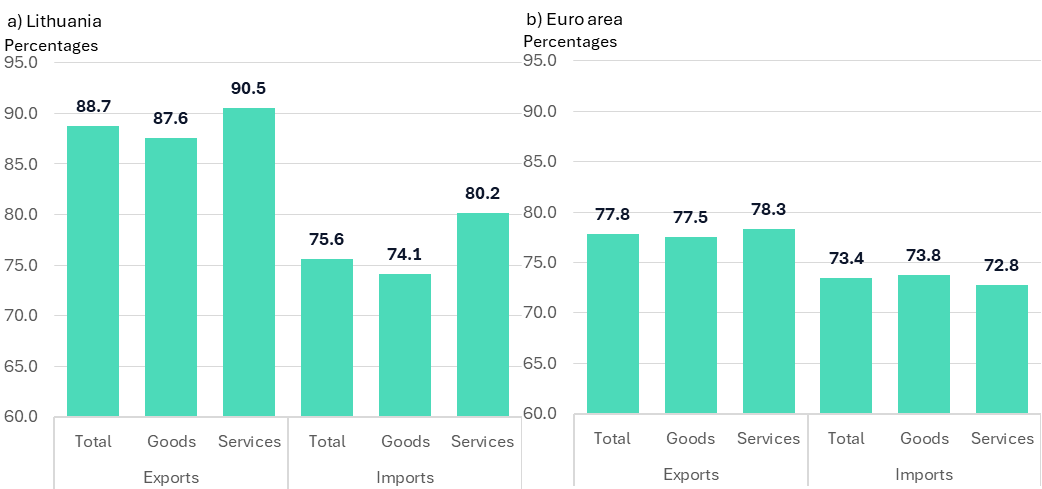
Sources: ECB, Eurostat and Lietuvos bankas calculations.
Note: The data covers international trade with both the euro area countries and other countries.
In the medium term, the strengthening euro may have a stronger impact on economic activity, especially if exports are oriented towards simpler products that are easier to substitute.
Chart C. Structure of exports of goods
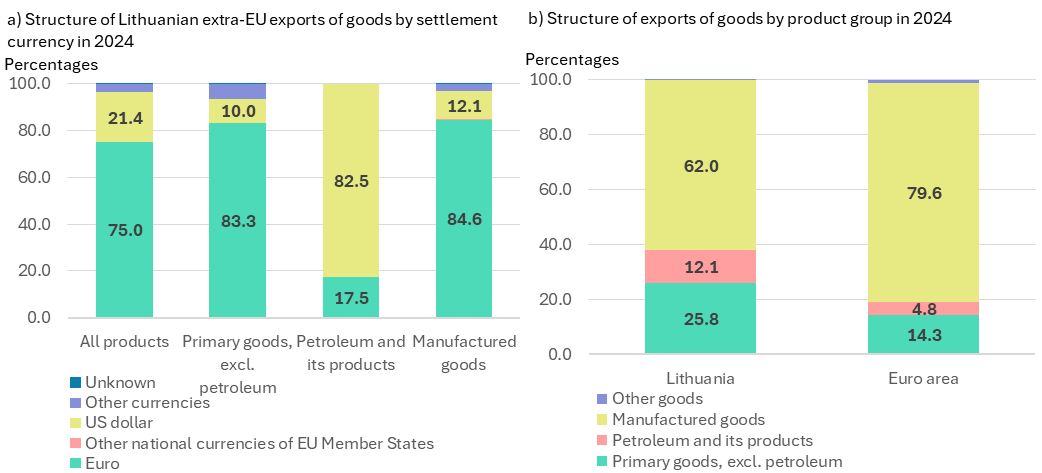
Sources: Eurostat and Lietuvos bankas calculations.
In summary, the euro appreciated against the US dollar last year, but this exchange rate change was not exceptionally large. Its effect on Lithuanian economy is likely to be limited. In the short term, the impact is mitigated by the fact that approximately half of all exports goes to the euro area countries and exports of goods and services are mostly settled in euro. This has a stabilising effect on the revenue of exporters. If the appreciation of the euro were to persist for a significant period, it could adversely affect Lithuanian companies, particularly those focused on the supply of simpler products that are easier to substitute (such as agricultural and food products, beverages) as they face stronger competition.
2.Real sector
Following relatively rapid growth in the first half of the year, economic growth in Lithuania slowed in the second half of 2025 but signs of recovery appeared by the end of the year (see Chart 2). The State Data Agency estimates that the annual growth rate was 2.1% in the third quarter of 2025 and 3.1% in the fourth quarter, with the quarterly growth rates of 0.3% and 1.7% respectively. This performance at the end of the year meant that the Lithuanian economy was 2.9% larger in 2025 than a year earlier, the growth rate was slightly stronger than the average over the past five years and aligned with the long-term trend (see Chart 2, right-hand panel). Economic growth in 2025 was fairly broad-based, with value added increasing across most major economic activities. Manufacturing, trade, and information and communication activities made the largest contributions to GDP growth. The value added generated by manufacturing increased by 3.4% over the year, while growth in the information and communications sector was even faster and stood at 8.3%. Among the manufacturing sectors, the manufacture of machinery and equipment stood out for its particularly strong growth, especially the computer, electronic and optical products sector, which grew by around 32% over the year. The automotive industry and chemical and plastics manufacturing companies faced difficulties and contributed negatively to the annual growth of the industrial sector. Exports in these sectors also show no signs of recovery. Value added of the trade sector increased, although household consumption grew moderately. The services sector remained one of the main drivers of economic growth, particularly due to the development of information and communication services. The transport and storage services sector began to recover gradually in 2025, but its activity remained below the pre-pandemic level.
Economic activity in Lithuania fluctuated significantly in 2025. Nevertheless, real GDP grew fairly strongly in 2025 (2.9%) and returned to its long-term trend.
Chart 2. GDP developments and contributions (production approach, left-hand panel) and GDP development trend since 2010 (right-hand panel)
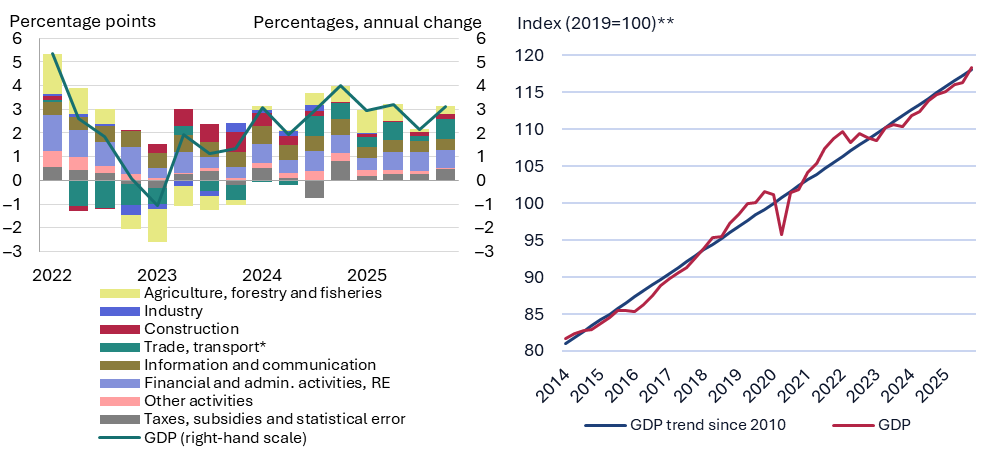
Sources: State Data Agency and Lietuvos bankas calculations.
* Including accommodation and catering.
** Adjusted for seasonal and workday effects.
Looking ahead, the Lithuanian economy is expected to continue growing, but greater fluctuations in its development are anticipated and government decisions will have a significant impact on them. In 2026, economic growth is expected to be driven primarily by domestic factors such as faster growth of household consumption and investment. The ongoing reform of the 2nd pillar pension funds will provide a significant boost to consumption. Investment growth will be supported by increasing public sector spending, particularly on defence and related projects. Weak external demand in Lithuania’s major trading partners, which hindered economic growth in 2025, is expected to pick up slightly early this year. Real GDP is projected to grow by 3.1% this year by 2 and 2.9% in 2027 and 2028 respectively
The rapid growth of household purchasing power continued to support consumption growth in 2025, although the rate of growth was more moderate at year end. The labour market situation remained broadly stable, but its development was no longer as favourable as before. Employment growth stalled, wage growth moderated and real income growth was increasingly constrained by faster-rising prices. Nevertheless, household consumption continued to grow and was an important driver of domestic demand, going up by 1.9% in 2025. Consumer sentiment was quite volatile, deteriorating at the beginning of the year (much like across Europe) due to trade wars and elevated economic uncertainty. From mid-summer, consumer confidence recovered and consumers began to project their own and Lithuania’s economic situation more favourably. However, in December and early this year, this indicator deteriorated, reflecting a slightly more cautious sentiment among households in the short term. In addition, geopolitical tensions related to developments in Iran may once again increase economic uncertainty and hamper consumption. This year, household consumption is expected to grow stronger due to rising incomes and an additional boost from the reform of the 2nd pillar pension funds, which will enable some of the population to use their savings for consumption. However, consumption growth will be constrained by prices that are still rising faster and more cautious household expectations. Household consumption is projected to increase by 3.8% in 2026, with the growth rate slowing significantly to 0.3% in 2027 and reaching 4.7% in 2028.
Household consumption is expected to grow stronger this year due to rising incomes and an additional boost from the reform of the 2nd pillar pension funds.
Chart 3. Consumer confidence indicator development (left-hand panel), household consumption development and its contributions (right-hand panel)
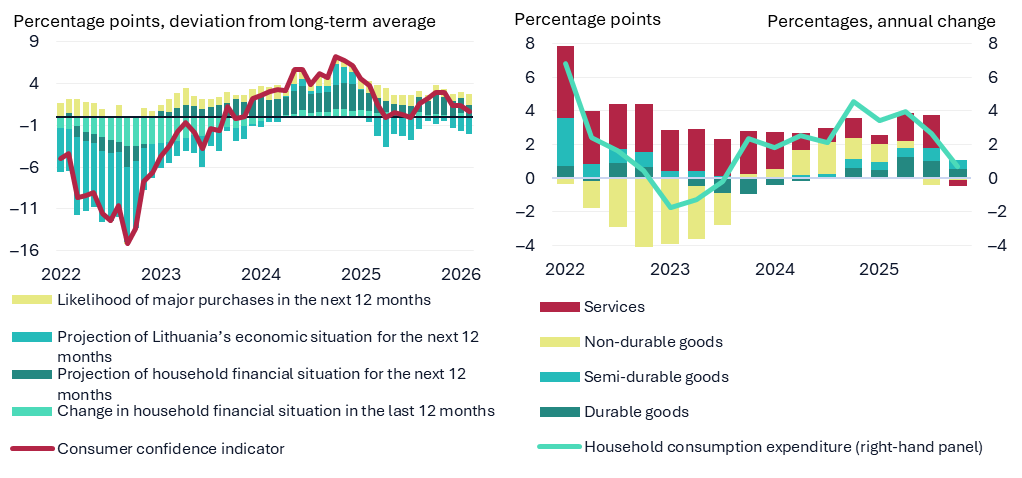
Sources: EC, State Data Agency and Lietuvos bankas calculations.
Investment also supported Lithuania’s economic growth in 2025, rising by 7.1% over the year. Last year, investment in vehicles, ICT equipment and capital goods contributed most to the growth in investment. At year end, investment growth was further bolstered by increased investment in non-residential buildings and engineering structures. The renewal of worn-out equipment and technological base, modernisation of production processes and improvement of efficiency accounted for the largest share of investment of the industrial sector, and these investments are expected to boost economic activity in the future. The development of production capacity remained significant but was on a smaller scale. Investment decisions were primarily driven by a positive sentiment about output demand, while financing and technological factors had a secondary, albeit still significant, influence. Development in the construction sector was sluggish for most of the year, but activity picked up towards the end of the year. Engineering works contributed significantly to this improvement, becoming one of the main drivers of the sector’s recovery. At the same time, investment in residential construction remained lower, although financing conditions gradually improved and activity in the housing market increased. Investment is expected to grow even stronger this year. This will be supported by increasing public sector spending, particularly on defence and related infrastructure projects. Investment is projected to increase by 11.7% in 2026, with growth rates of 3% and 3.7% in 2027 and 2028 respectively.
Chart 4. Investment contributions
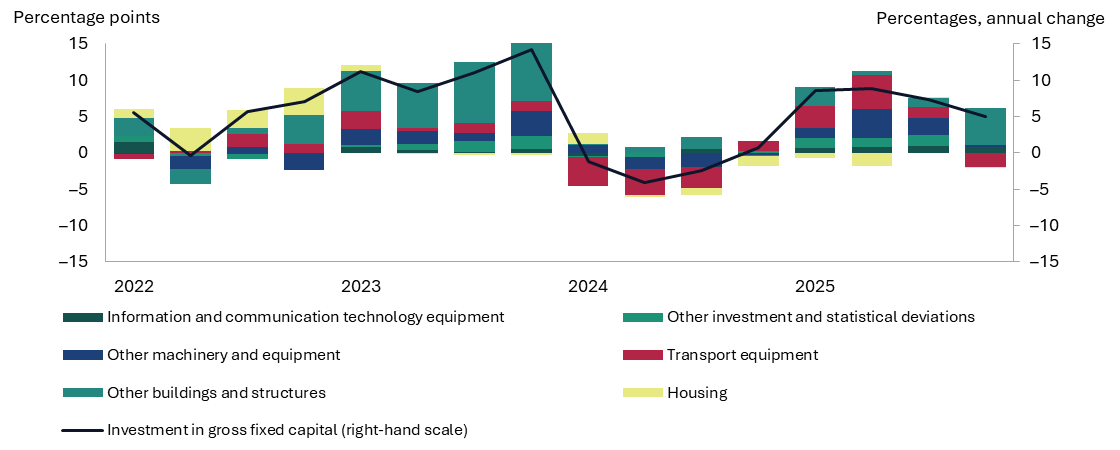
Sources: State Data Agency and Lietuvos bankas calculations.
Prepared by Ernestas Virbickas
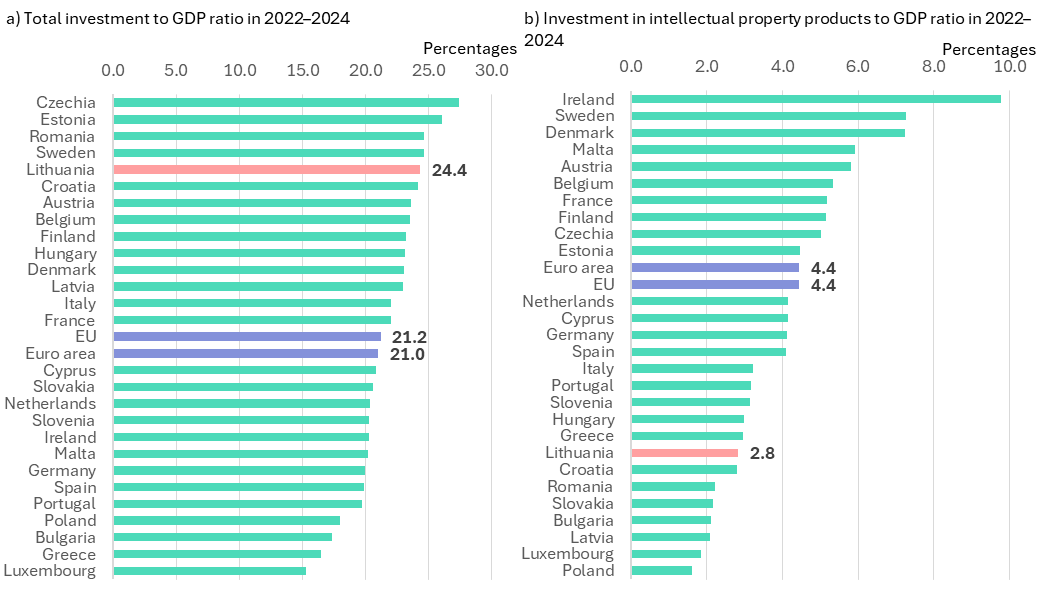
As in many countries, investment in Lithuania fluctuates significantly, but for more than a decade it has been growing faster than economy as a whole. Since 2011, when Lithuania's economy began to recover from the global financial crisis, until 2024 the investment to GDP ratio rose from 19% to 24%. This ratio in Lithuania exceeds the EU average and is one of the highest among EU countries (see Chart A, panel a). During the mentioned period, investment growth was primarily driven by private sector non-housing investment (which accounted for approximately 72% of total investment growth), i.e. investment required for business expansion and modernisation contributed the most. Roughly 17% of the total increase in investment was driven by housing investment and roughly 11% by general government investment.
The level of investment in Lithuania is quite high, but investment in intellectual property products is lower than in most EU countries.
Chart A. Investment to GDP ratio in Lithuania and the EU
Sources: Eurostat and Lietuvos bankas calculations.
Note: The data used for the calculations are at constant prices.
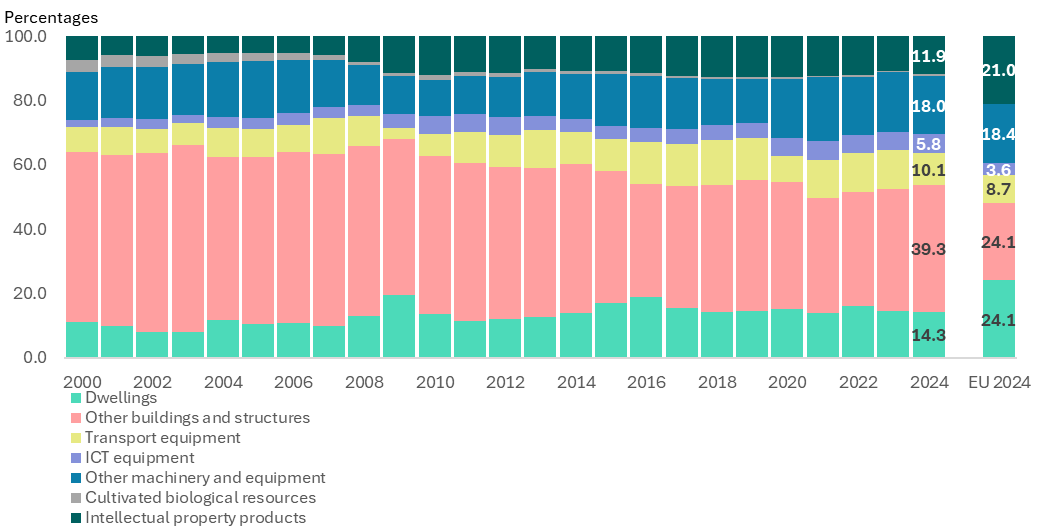
The share of investment in intellectual property products relative to total investment in Lithuania is nearly two times lower than the EU average, and this share is essentially not growing.
Chart B. Investment structure in Lithuania and the EU
Sources: Eurostat and Lietuvos bankas calculations.
Note: The data used for the calculations are at constant prices.
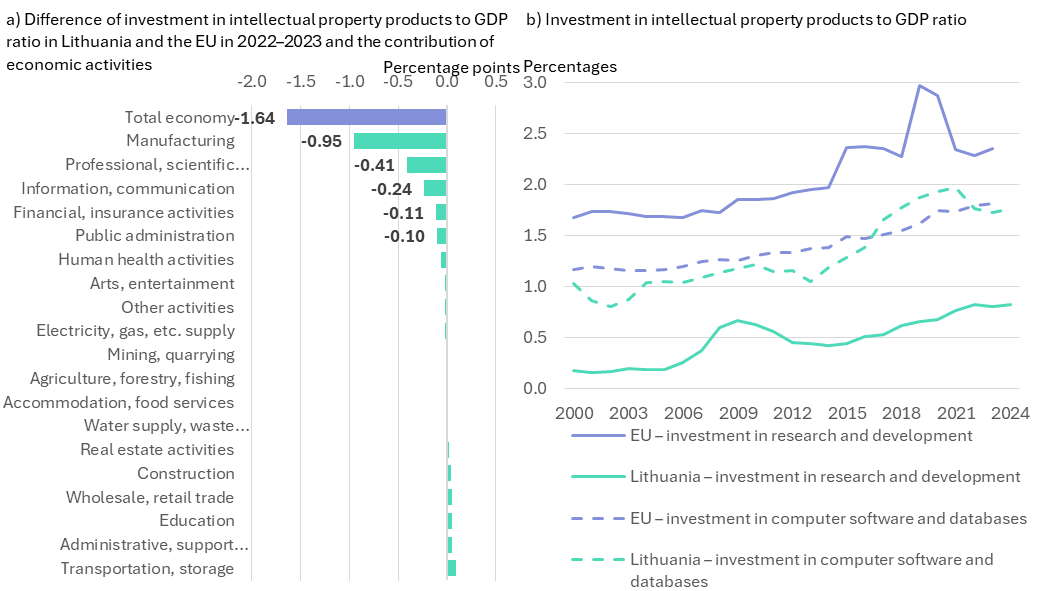
Manufacturing and professional, scientific, technical services contribute most to the gap in investment in intellectual property products compared to the EU average. Investment in research and development is particularly low in Lithuania.
Chart C. Investment in intellectual property products to GDP ratio in Lithuania and the EU
Sources: Eurostat and Lietuvos bankas calculations.
Note: The data used for the calculations are at current prices; titles of economic activities are abbreviated.
Prepared by Kasparas Vasiliauskas
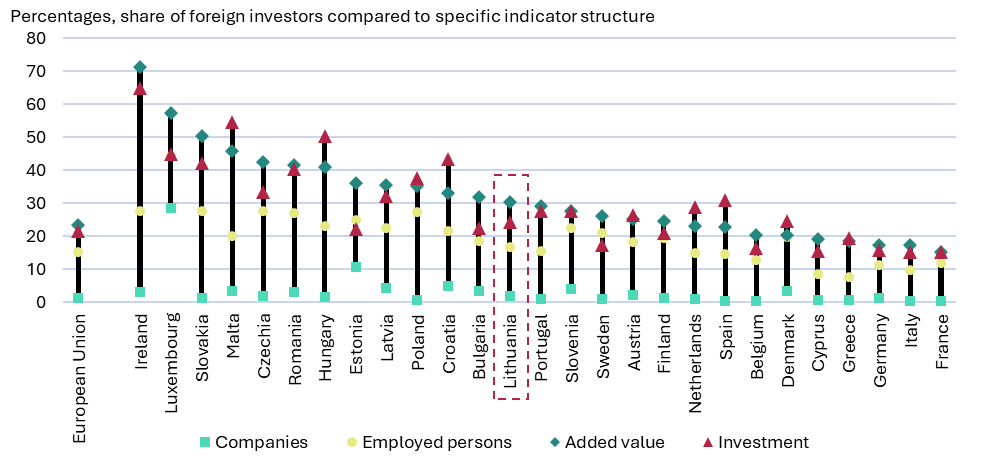
A comparison of Lithuania with other EU countries indicates that the dependence of the Lithuanian economy on foreign investors is broadly in line with the EU average and is significantly lower than in the leading countries that attract the most FDI, as well as lower than in neighbouring countries. For instance, in Ireland, Luxembourg, and Slovakia, more than half of the total value added in the economy is generated by companies run by foreign investors, so the structure of their economies is particularly closely linked to their activities. In Latvia, Estonia, and Poland, companies controlled by foreign investors generate more than a third of value added and employ a fifth of the workforce.
In Lithuania, companies run by foreign investors account for nearly 2% of all businesses, but their economic role is disproportionately large as they employ 16.9% of the workforce, account for nearly a quarter of total investment and generate nearly a third of Lithuania’s total value added.
Chart A. Impact of foreign investors on the level of key macroeconomic indicators in 2021–2023
Sources: Eurostat and Lietuvos bankas calculations.
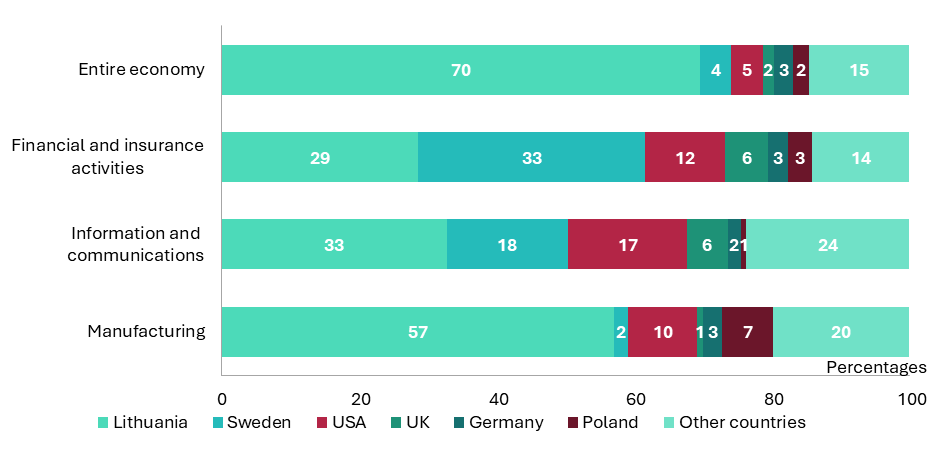
Apart from local investors, the greatest added value in Lithuania is generated by companies controlled by foreign investors from the United States and Sweden, which together account for nearly one-tenth of Lithuania’s total added value (see Chart B). The contribution of other foreign countries totals about one-fifth; except for Germany, no single country has a share larger than 2%. This indicates that Lithuania’s economic dependence on foreign investors has a fairly high geographical diversification.
Lithuania’s economic dependence on foreign investors has a fairly high geographical diversification. Nevertheless, the role of foreign investors is significant in certain sectors, particularly in finance, information and communications and certain manufacturing activities.
Chart B. Distribution of value added generated by foreign and Lithuanian investors across the economy and in individual sectors, 2021–2023
Sources: Eurostat and Lietuvos bankas calculations.
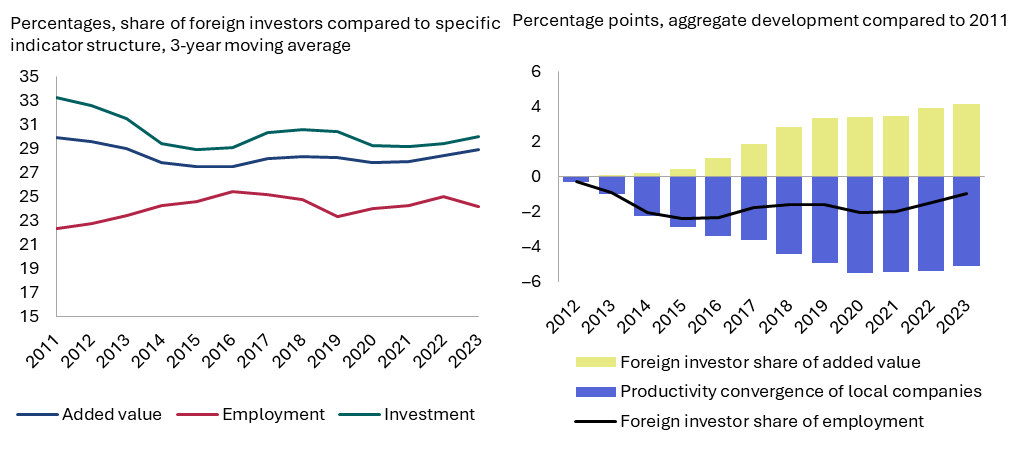
Analysis of the development of foreign investors’ role in the Lithuanian economy (excluding financial and insurance activities and general government) shows that their role has declined slightly over a decade (see Chart C, left-hand panel). In 2023, companies run by foreign investors generated 29% of total value added and accounted for 30% of total investment, down by 1 and 3 percentage points from 2011. Over the same period, the share of employment increased by nearly 2 percentage points, from 22% in 2011 to 24% in 2023. The smaller share of value added by foreign investors in the economy, despite the increase in the employment share, can be explained by the productivity convergence of local investors (see Chart C, right-hand panel). Over more than a decade, companies of local investors have bridged the productivity gap with firms of foreign investors by nearly a quarter. Positive indirect effects of FDI, such as the spillover of technology, management practices and organisational solutions from companies run by foreign investors to those run by local investors, are likely to have also contributed to this convergence.
Although the share of employment at companies run by foreign investors increased, the strong growth of productivity of companies owned by local investors and the resulting convergence reduced the share of value added generated by foreign investors in the economy between 2011 and 2023.
Chart C. Development of the impact of foreign investors on macroeconomic indicators (left-hand panel) and contributions to the growth of value added of foreign investors since 2011 (right-hand panel)
Sources: Eurostat and Lietuvos bankas calculations.
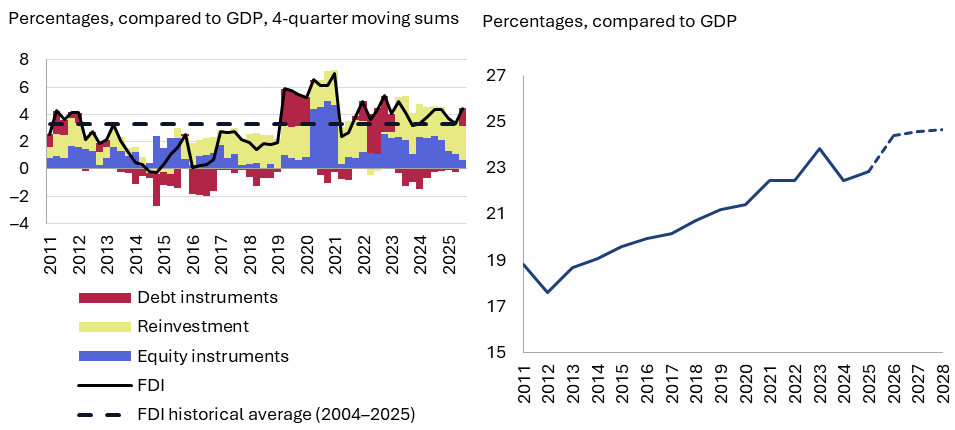
In summary, it should be noted that foreign investors continue to play a significant role in the Lithuanian economy, and the latest operational FDI figures show no signs of foreign investment pulling out of Lithuania (see Chart D, panel a). Although the number of new investors declined from the peak reached in 2019–2020 and new equity FDI flows moderated, the overall level of FDI is supported by significant reinvestment by companies already operating in Lithuania, with their volume exceeding the historical average and reflecting the confidence of existing foreign investors in Lithuania.
The increased challenges in attracting new investors can be attributed not only to the deteriorating geopolitical situation, but also to changes in the structure of the Lithuanian economy. As Lithuania transitions to higher-value-added manufacturing and gradually becomes a country of higher wages, attracting investment is becoming more complex and increasingly focused on larger, technologically more advanced projects that require longer lead times. At the same time, the growing investment activity of local companies and the general government suggests that the share of FDI in the overall investment structure may gradually decline over time. Local and general government investment is likely to be the main future driver of growth of total investment in Lithuania (see Chart D, panel b). However, this would not imply a diminishing role for foreign investors in the Lithuanian economy. FDI remains an important factor for productivity, capital accumulation and structural transformation, while active reinvestment by companies already operating in Lithuania reflects sustained confidence in Lithuania’s economy. Therefore, even as the composition of investment changes, the contribution of foreign investors to the qualitative development of the economy will remain significant.
The latest data indicate that, although attracting new foreign investors is becoming more challenging, the overall level of FDI remains high due to significant reinvestment by existing companies.
Chart D. Trends in FDI inflows to Lithuania (left-hand panel), trends in total investment and Lietuvos bankas projections 2026–2028 (right-hand panel)
Sources: Eurostat, Lietuvos bankas and Lietuvos bankas calculations.
Prepared by Darius Imbrasas
European manufacturing companies have faced a number of challenges in recent years. Increasing geopolitical fragmentation and tariff-related trade disruptions have hampered export opportunities for European manufacturers, while the appreciating euro has reduced price competitiveness on foreign markets. As a result, manufacturing companies operating in the EU are facing greater pressure on profitability and export performance. Since the EU and euro area member states have limited scope at the national level to adjust exchange rates or trade policy, companies and governments in these countries are focusing more on other factors that can support competitiveness.
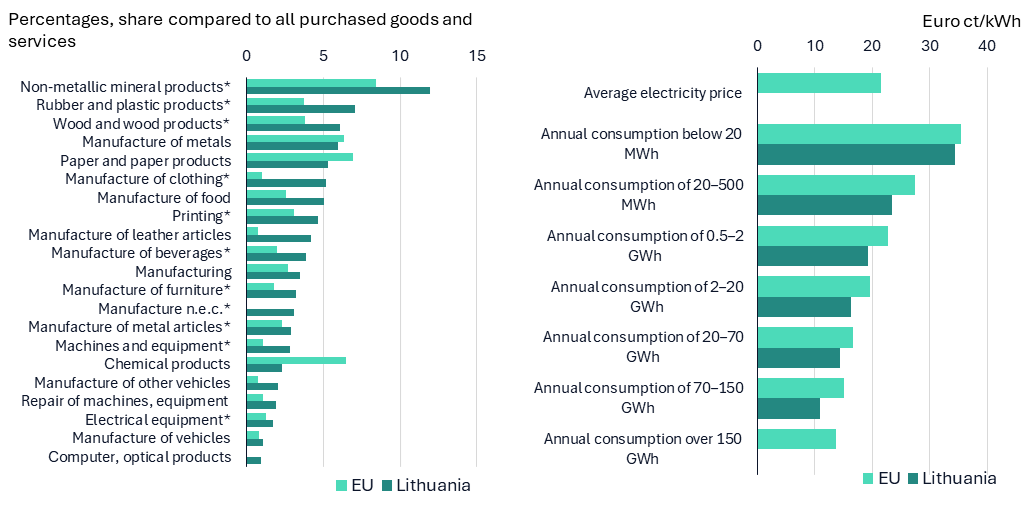
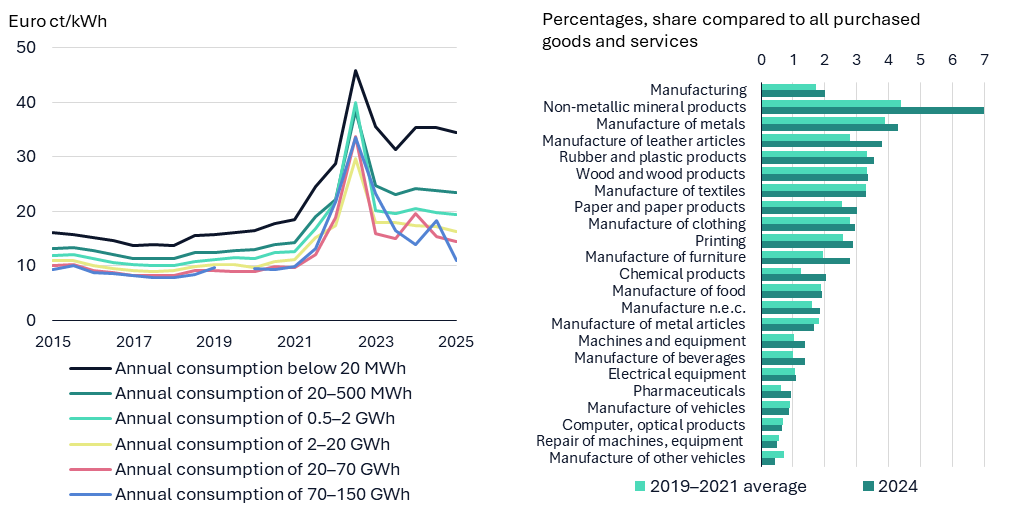
One possible factor is cheaper and more efficiently used energy. Energy costs typically account for a notable portion of production costs. Chart A provides a comparison of the manufacturing sectors in the EU and Lithuania based on the share of energy costs relative to purchased goods and services. In 2021–2023, these costs averaged 2.7% in the EU and 3.5% in Lithuania. There are significant differences between sectors in both the EU as a whole and in Lithuania, with this share exceeding 6% in the most energy-dependent sectors and being below 2% in the least dependent ones. During this period, the largest share of energy costs in the EU manufacturing sector relative to all purchased goods and services was the manufacture of non-metallic mineral products, paper and paper products, chemical products and metal products, where these costs accounted for 6.0–8.5% of all purchased goods and services. In Lithuania, energy costs accounted for more than 6% of total expenditure on purchased goods and services in the manufacture of wood and wood products (6.1%), rubber and plastic products (7.1%) and non-metallic mineral products (11.9%). It should be noted that energy costs for most of manufacturing activities in Lithuania are higher than the EU average.
Energy costs for most of manufacturing activities in Lithuania are higher than the EU average.
Chart A. Share of energy costs in manufacturing relative to total purchased goods and services (left-hand panel) and electricity prices for non-household consumers by electricity consumption in the first half of 2025 (right-hand panel)
Sources: Eurostat and Lietuvos bankas calculations.
* There are no EU data for 2021–2023 for the manufacture of computer and optical equipment and other manufacture not classified elsewhere; only the data for 2022 are available for the manufacture of furniture and rubber and plastic products; only the data for 2021–2022 for the manufacture of beverages, wood and wood products; only the data for 2022–2023 for the manufacture of clothing, machinery and equipment; only the data for 2021 and 2023 for printing, manufacture of non-metallic mineral products, metal products and electrical equipment.
On the EU market, companies with lower electricity consumption pay more for electricity. The data published by Eurostat on electricity prices for non-household consumers in the EU show that there are significant price differences between companies that consume a great deal of electricity and those that consume very little (see Chart A). Companies consuming 20 MWh or less of electricity per year paid 0.36 EUR/kWh in the first half of 2025, while the largest ones consuming 70–150 GWh paid 0.15 EUR/kWh. Significant differences in electricity prices were also observed in Lithuania, with the smallest consumers paying 0.34 EUR/kWh and the largest ones paying 0.11 EUR/kWh. Nevertheless, across all non-residential electricity consumption categories, electricity prices in Lithuania were lower than the EU average in the first half of 2025. The largest price differences between the EU as a whole and Lithuania were recorded among the largest electricity consumers. However, the lower the annual electricity consumption, the narrower the price difference, which stood at 3.2% for the group of companies with the lowest electricity consumption (27.1% for the largest consumers). The electricity price for this consumption group in Lithuania was among the six highest in the EU. For companies consuming 20,000–70,000 MWh per year, it was eleventh highest in the EU, while it was among the lowest for those consuming even more.
Although electricity prices in Lithuania are lower than the EU average, they remain significantly higher than before russia’s full-scale war against Ukraine. After russia launched its full-scale war against Ukraine, electricity prices in Lithuania rose sharply. They were particularly high in the second half of 2022, but fell significantly in the first half of 2023 (see Chart B). However, since then a more noticeable decline in electricity prices has been observed only for the non-household consumer group with extremely large consumption of electricity, while electricity prices for the non-household consumer group with lower consumption did not change much. In the first half of 2025, electricity prices were 60–130% higher than in 2015–2019 for nearly all non-household consumer groups, with the exception of the non-household consumer group with very high consumption for which the difference was nearly 25%.
Due to significantly higher electricity prices, electricity costs still account for a larger share of total costs for goods and services than they did prior to 2022 in many manufacturing activities.
Chart B. Development of electricity prices for non-household consumers in Lithuania by electricity consumption (left-hand panel) and share of electricity costs relative to total purchased goods and services in manufacturing (right-hand panel)
Sources: Eurostat, State Data Agency and Lietuvos bankas calculations.
The share of energy costs in Lithuania's manufacturing relative to total purchased goods and services remains higher than before russia’s full-scale war against Ukraine but it is gradually declining. Following the start of russia’s full-scale war against Ukraine, electricity costs for Lithuania’s manufacturing activities rose sharply due to the resulting energy price shock. In 2022, the share of electricity costs in most manufacturing activities relative to all purchased goods and services increased by 25–100%, with particularly sharp rises in the paper and paper products, textiles, metals and pharmaceutical activities. Since 2023, as electricity prices fell and companies began deploying energy-saving solutions, the share of electricity costs relative to all purchased goods and services began to shrink, but it remained higher than before 2022 in most activities in 2024 (see Chart B). A significant portion of Lithuania’s major and relatively energy-intensive manufacturing activities, such as furniture and chemical industry as well as companies manufacturing non-metallic mineral products, continue to spend significantly more on electricity. Among the major sectors, only companies in the food industry managed to cut their share of electricity costs to the pre-2022 level. A number of engineering industry companies also managed to keep electricity costs under control. However, for many of these activities, the share of electricity costs relative to all purchased goods and services is among the lowest in manufacturing.
Available information indicates that electricity prices for non-household consumers in Lithuania continue to be higher than prior to russia’s full-scale war against Ukraine, and their reduction would boost the ability of manufacturing companies to compete on the international market. Therefore, the energy policy should continue to focus on increasing competitive domestic electricity generation, regional electricity grid integration (increasing transmission capacity), more efficient energy consumption and reducing weather-related volatility of electricity prices.
3.Labour market
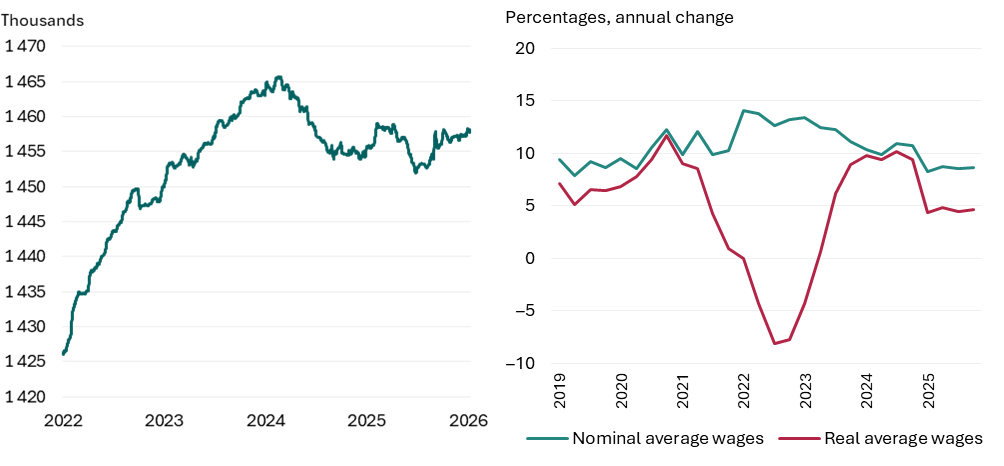
Chart 5. Number of employed persons (left-hand panel) and nominal and real average monthly wages (right-hand panel)
Sources: State Social Insurance Fund, State Data Agency and Lietuvos bankas calculations.
The labour market situation is expected to remain stable in 2026. Lietuvos bankas estimates the nominal average monthly wage to grow by 8.0%, while inflation is projected to rise to 5.1%, with real wages going up by around 2.8%. Employment development will remain moderate, with employment projected to remain unchanged in 2026. The unemployment rate is expected to fall by 0.2 percentage points to 6.7%, while the labour force is expected to continue shrinking due to unfavourable domestic demographic trends and stricter migration policies.
Prepared by Jose Garcia-Louzao and Linas Tarasonis
Since 2015, the share of non-Lithuanian workers in total employment has increased steadily, with a marked acceleration from 2022 onwards. Changes in aggregate employment growth can reflect adjustments in hiring, separations, or both, and these margins may differ across domestic and foreign nationals. Even when net employment changes are modest, the underlying flow dynamics may imply different degrees of labor market dynamism. Using Social Security data covering all jobs in Lithuania between January 2010 and December 2024, this box decomposes employment developments into hirings and separations to identify the margins driving aggregate employment growth.
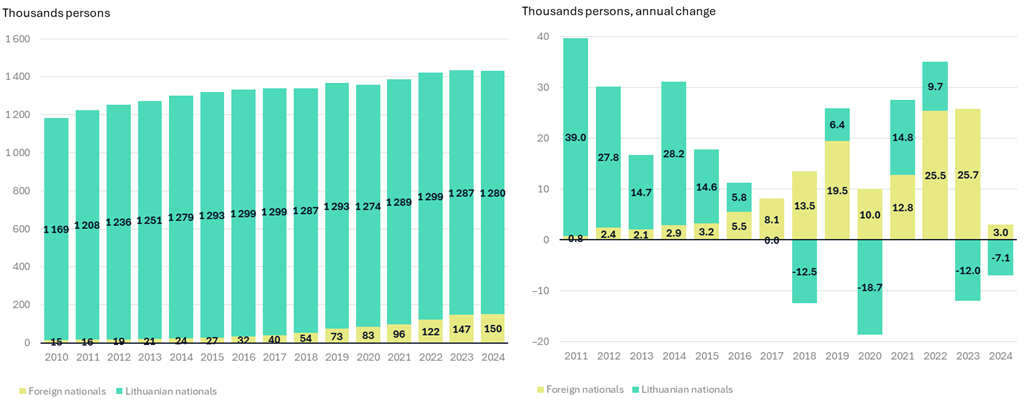
After a decade of sustainable development, employment growth in Lithuania has slowed in recent years. As shown in the left-hand panel of Chart A, the number of employees increased by 245,000 in 2010–2024 (from 1,185,000 to 1,430,000), or an average of 17,500 per year. However, net employment growth has slowed recently: in 2023 and 2024, the economy created slightly fewer than 10,000 jobs, despite a significant increase in the number of foreign workers. A key question is whether this slowdown reflects lower hiring, higher separations, or adjustments along both margins, and how firms have relied on foreign versus Lithuanian nationals.
Chart A. Average monthly employment (left-hand panel) and its change by nationality (right-hand panel)
Sources: State Social Insurance Fund and Lietuvos bankas calculations.
Analysis of changes in employment by employee nationality indicates that foreign nationals accounted for the bulk of the increase in 2020–2024. Until 2015, net employment growth was driven almost entirely by Lithuanian nationals, while the role of foreign nationals was minor. In 2015–2021, net employment became more balanced between Lithuanian and foreign nationals, as the hiring of foreign nationals grew more rapidly in line with the increasing total employment. However, starting from 2022, as total employment slowed, a growing dependence on foreign nationals became apparent, with net employment of Lithuanian nationals turning negative, while that of foreign nationals remaining positive and accounting for the majority of the recorded modest employment growth.
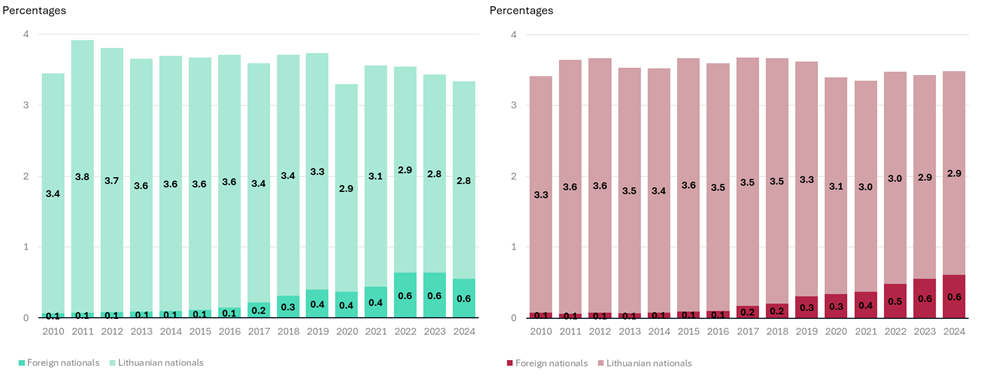
Chart B. Contribution by nationality to average monthly hiring (left-hand panel) and separation rates of employment (right-hand panel)
Sources: State Social Insurance Fund and Lietuvos bankas calculations.
Aggregate employment dynamics in Lithuania mask substantial worker reallocation. Chart B shows that in 2010–2024, an average of about 3.6% of jobs were newly filled each month (left-hand panel), while 3.5% ended in separation of employment (right-hand panel), resulting in the overall labour turnover rate of around 7%. This level of employee turnover is similar to that in the US, with its labour market having some of the highest worker reallocation rates among the developed economies. However, worker flows have weakened since 2022: the monthly hiring rate fell from 3.6% to 3.3%, while the employment separation rate remained broadly stable, causing net employment growth to slow. During the same period, foreign nationals accounted for an increasing share of both hiring and separation, reflecting their growing share of total employment. It is important to note that the reallocation rate among foreign workers is the highest: their hiring and separation rates increased, while the hiring rate for Lithuanian nationals declined steadily, with the separation rate remaining largely unchanged.
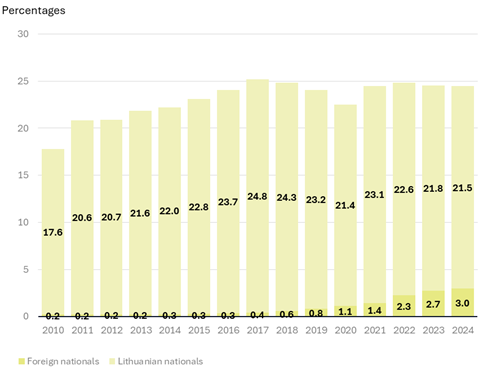
Chart C. Worker poaching rates across firms by nationality
Sources: State Social Insurance Fund and Lietuvos bankas calculations.
The hiring structure among Lithuanian employers has changed not only due to the decline in hiring intensity. As shown in Chart C, the share of hires involving workers poached from other employers increased in 2010–2024. This change was primarily driven by foreign nationals: Lithuanian companies are increasingly hiring foreign nationals from other domestic employers instead of the unemployed or directly from abroad. In other words, although the overall number of foreign nationals hired increased, an ever-larger share of these hires involves poaching workers from other companies on the domestic market. The recent increase in the hiring of foreign nationals is mainly related to the attraction of foreign nationals already working in Lithuania. Meanwhile, the rate of poaching of Lithuanian nationals remained largely stable, despite the decline in the overall hiring rate.
Over the past decade, most net employment growth has been driven by foreign workers, while net employment among Lithuanian nationals has stagnated or declined in recent years. At the same time, hiring and separation rates among foreign workers have increased, and firms increasingly recruit them from other domestic employers. These developments point to a structural shift in the Lithuanian labor market, with potential implications for wage dynamics, productivity growth, and longer-term demographic pressures.
For policy, the central issue is identifying the forces behind the growing reliance on non-Lithuanian workers. If this development primarily reflects strong labor demand and persistent skill shortages, it would increase the importance of migration policies aimed at attracting the required skills, complemented by integration measures that ensure the long-term effectiveness of migration policy. If, instead, it reflects weaker domestic labor supply or changing participation incentives among Lithuanian nationals, the policy focus would shift toward labor market activation and social policy design.
Prepared by Rokas Budrauskas and Ernestas Virbickas
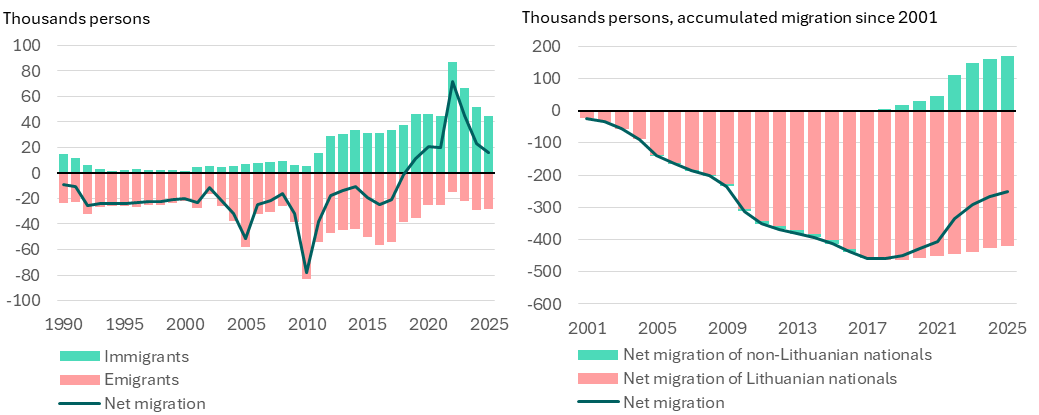
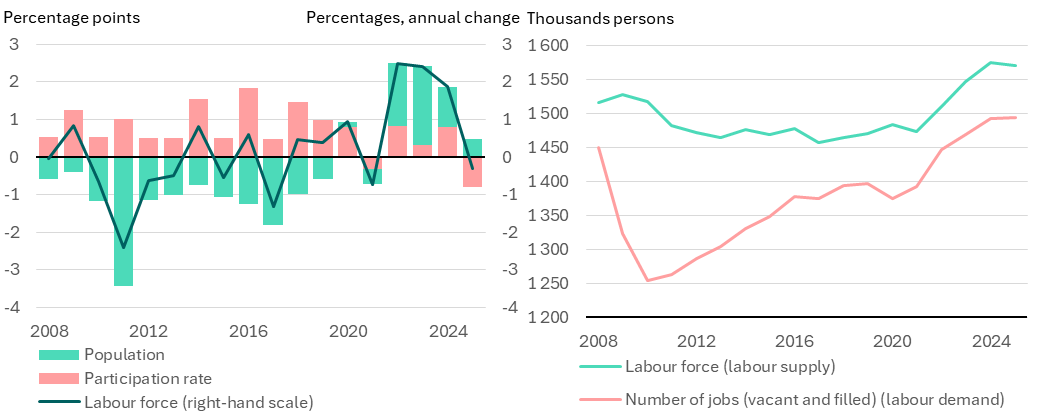
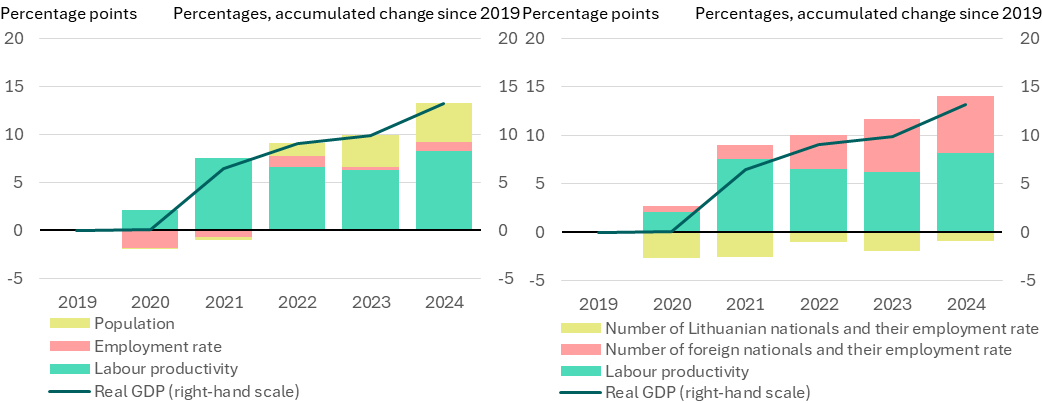
For a while, international migration makes a significant impact on demographic and economic developments in Lithuania. The net emigration that prevailed in the first decades of independence has reversed in the recent years (see Chart A, left-hand panel). Less intensive emigration of local nationals and a larger influx of foreign nationals into Lithuania make a noticeable impact on the labour force and employment, affect the situation in the labour market as well as overall economic activity.
Chart A. International migration
Sources: State Data Agency and Lietuvos bankas calculations.
Chart B. Labour force (left-hand panel) and labour supply and demand (right-hand panel)
Sources: State Data Agency and Lietuvos bankas calculations.
Chart C. Real GDP
Sources: Eurostat, State Social Insurance Fund and Lietuvos bankas calculations.
Note: Calculations are based on data from the Labour Force Survey on the number of employed persons aged 15–64 and the total population aged 15–64, broken down by nationality; calculations also use data on employees by nationality published in the box entitled ‘Lithuanian labour market development: Growing role of migration’ of this review.
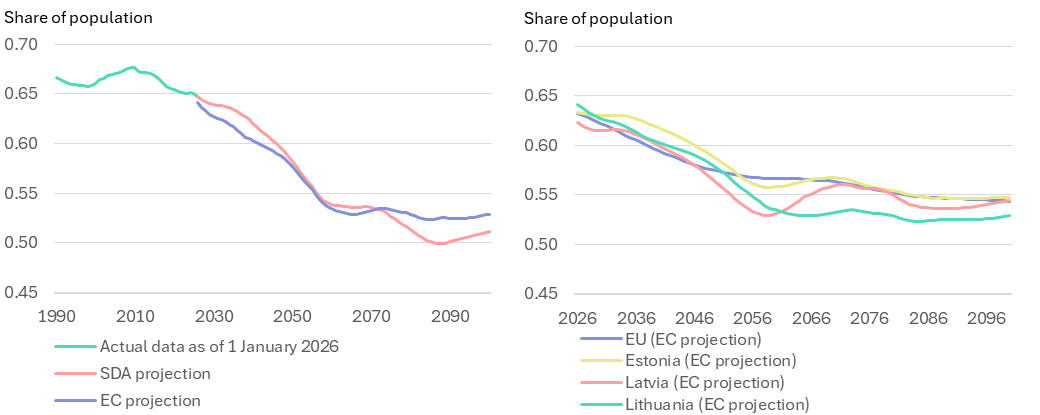
Projections indicate that the share of working-age population will decline, the demand for labour from abroad will increase. The latest projections of both the State Data Agency and the EC indicate that the share of population aged 15–64, which peaked during the global financial crisis in 2009–2010, will decline over the next few decades (see Chart D, left-hand panel). Similar demographic trends are projected for Latvia, while the situation in Estonia may be slightly better than in Lithuania in the coming decades, but the share of the working-age population will also decline in this neighbouring country (see Chart D, right-hand panel). This indicates that the demand for labour from abroad will increase in both Lithuania and the other Baltic countries.
Chart D. The share of population aged 15–64 in Lithuania (left-hand panel) and EU countries (right-hand panel)
Sources: Eurostat, State Data Agency and Lietuvos bankas calculations.
Note: Based on the State Data Agency (SDA) projections published in 2025 and the EC projections published in 2023.
International migration, however, does not itself guarantee a favourable economic outcome. In the short term, migration helps mitigate demographic constraints and sustain economic activity. However, its long-term effects are not necessarily unequivocally positive. Social integration, including the ability to smoothly exercise rights provided by the state and access services and opportunities offered by the public and private sectors, is a key prerequisite for long-term economic integration. Insufficient access to information, lack of awareness of rights and duties as well as other social barriers can lead to short-term employment for foreign nationals, greater volatility in the labour market, lower labour productivity and diminished international attractiveness of Lithuania.
4.External sector
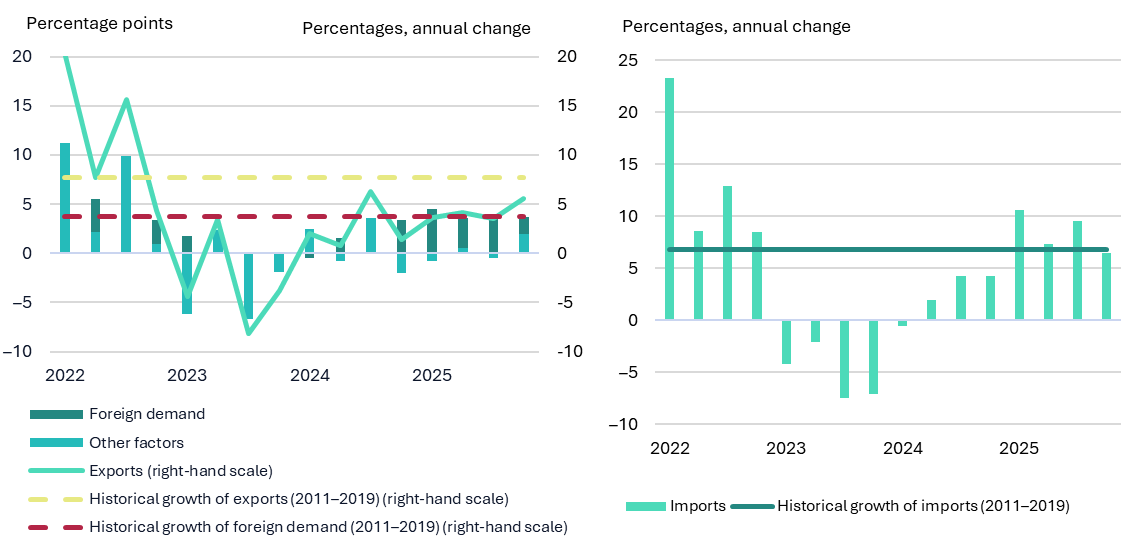
In the second half of 2025, net exports declined as imports outpaced exports. Over the course of 2025, real exports increased by 4.2%. At the beginning of the year, export growth was driven by frontloading and stockpiling in anticipation of forthcoming higher US tariffs. However, annual growth of both exports and imports is projected to slow down in the coming years due to base effects, and exports will also be less favourably affected by the declining foreign demand.
Following a significant surge in 2025, exports and imports are projected to grow more slowly in the coming years, primarily due to the weakening foreign demand.
Chart 6. Historical development and projections of real exports of goods and services (left-hand panel) and imports (right-hand panel)
Sources: ECB, State Data Agency and Lietuvos bankas calculations.
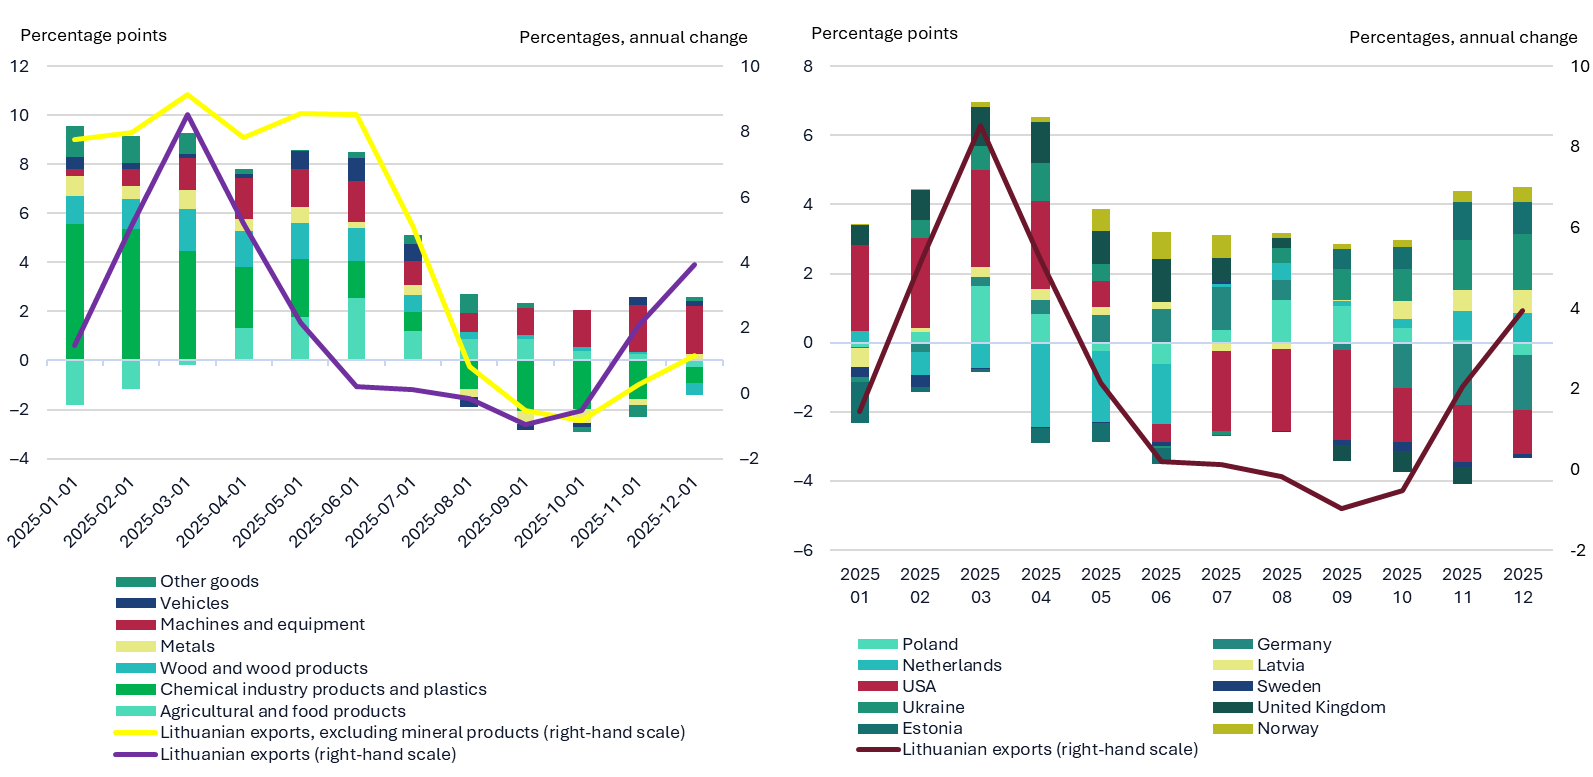
In the second half of 2025, the development of nominal exports of goods of Lithuanian origin was driven by rising exports of machinery and equipment, which were largely offset by the decline of the chemical industry, so the annual growth measured using a 3-month moving average was modest and averaged 0.74%. Exports of machinery and equipment had a positive impact, with their contribution to the annual growth of total exports of goods of Lithuanian origin amounting to around 1.4 percentage points, mainly due to increased exports of electrical signal generators to Ukraine, while chemical industry products and plastics had a negative impact, reducing the overall indicator by around 1.1 percentage points; exports of reagents and plastics to the US fell particularly sharply, likely due to tariffs and the weakening dollar. Geographically, the largest negative contribution to the overall annual growth of exports of goods of Lithuanian origin was recorded in the US market and stood at around 2 percentage points, mainly due to exports of mineral products and chemical industry products, as well as in Germany, where exports of agricultural and food products contracted the most. Meanwhile, trade with Estonia, Ukraine, Latvia and the Netherlands increased, but the expansion of these markets only partially offset the decline of exports to major partners.
In the second half of 2025, the development of exports of goods of Lithuanian origin was shaped by growth in machinery and equipment, which was offset by the decline of the chemical industry, while exports to the US and Germany had the greatest negative impact geographically.
Chart 7. Development of exports of goods of Lithuanian origin by product group (3-month moving average) (left-hand panel) and by geographic markets (3-month moving average) (right-hand panel)
Sources: State Data Agency and Lietuvos bankas calculations.
The development of re-exports shows signs of stabilisation: in December 2025, re-exports began to grow again after a prolonged period of decline. Re-exports of machinery and equipment remained the main negative factor, but re-exports of vehicles, metals and food products were already on the rise. The ratio of re-exports to GDP fell to approximately 14% in 2025, following a surge of 26–29% in 2022. Meanwhile, nominal imports of goods continued to grow in the second half of 2025. Volumes increased across all major product groups. A geographically more significant decrease was recorded only in imports from Saudi Arabia, which contributed approximately 1.2 percentage points to the annual change in total imports, while imports from other major trading partners increased steadily.
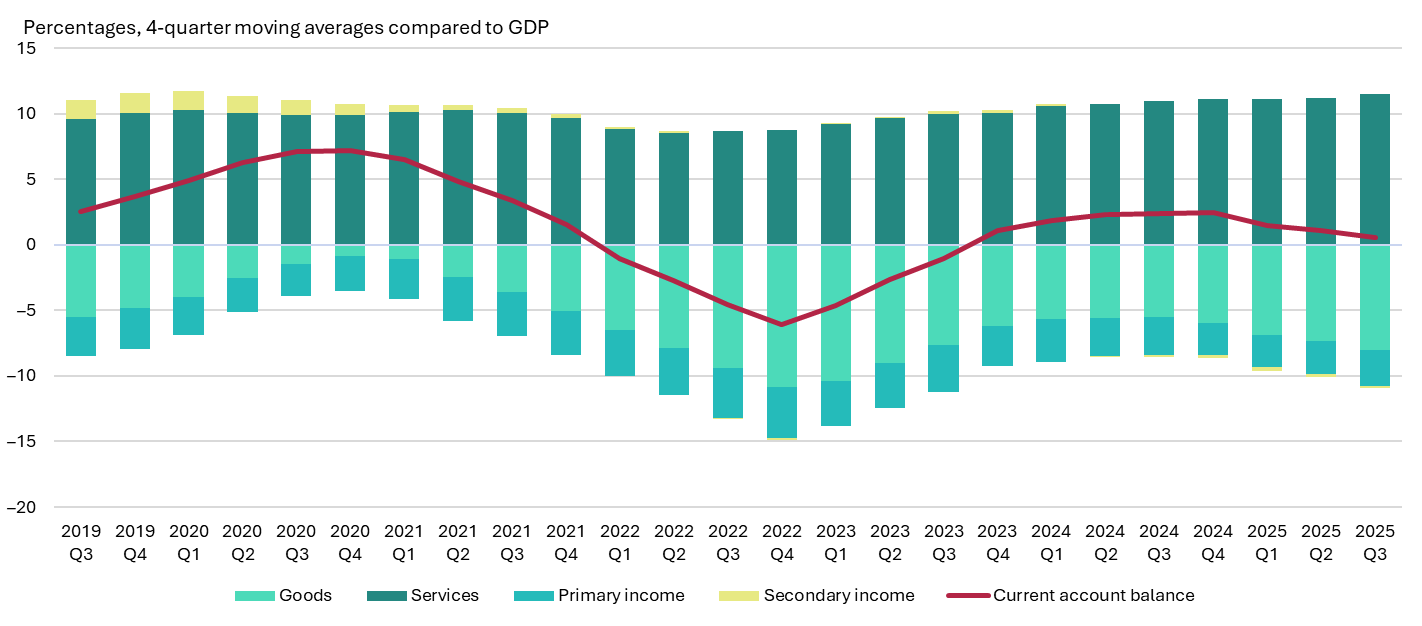
In the third quarter of 2025, the current account surplus continued to decline. The main reason for this was a worsening goods trade balance. The deficit in the goods account widened due to a significant increase in imports, partly driven by frontloading of imports by companies in anticipation of potential price increases resulting from planned higher tariffs, while export revenues have largely stabilised in recent quarters. The services balance remained positive, but its growth was sluggish as both exports and imports of services increased at a similar pace. The balance of primary income remained largely unchanged.
Exports of services to major partners continued to grow, with transport services accounting for the largest share. Germany dominates this segment, accounting for about 18.5% of total exports of transport services in the third quarter. France and the United Kingdom followed, each accounting for approximately 8%.
The current account surplus continued to decline in the third quarter of 2025 due to the worsening goods trade balance.
Chart 8. Current account balance and its components
Sources: State Data Agency, Lietuvos bankas and Lietuvos bankas calculations.
5.Prices
Soaring food prices and persistently rising service costs were the primary components contributing to higher inflation in 2025. Prices of services continue to rise at an annual rate of almost 5.8% and have been the most significant component of headline inflation for several years. In 2025, rising food prices also significantly contributed to headline inflation becoming the second most important component of inflation (see Chart 9, left-hand panel). These components accounted for nearly the entire increase in the general price level. Compared to 2024, prices for both unprocessed food, which is more subject to seasonal fluctuations, and processed food rose sharply. Prices for all food, excluding alcoholic beverages and tobacco, were 4.5% higher than a year earlier. Rising prices of alcohol and tobacco products, dairy and meat products, fruit and vegetables also had a significant impact on inflation.
After rising at the beginning of 2025, average annual inflation stood at 3.4% last year. Inflation is expected to increase significantly this year.
Chart 9. HICP inflation and its contributions (left-hand panel) and inflation projections (right-hand panel)
Sources: State Data Agency and Lietuvos bankas calculations.
6.Monetary policy of the Eurosystem
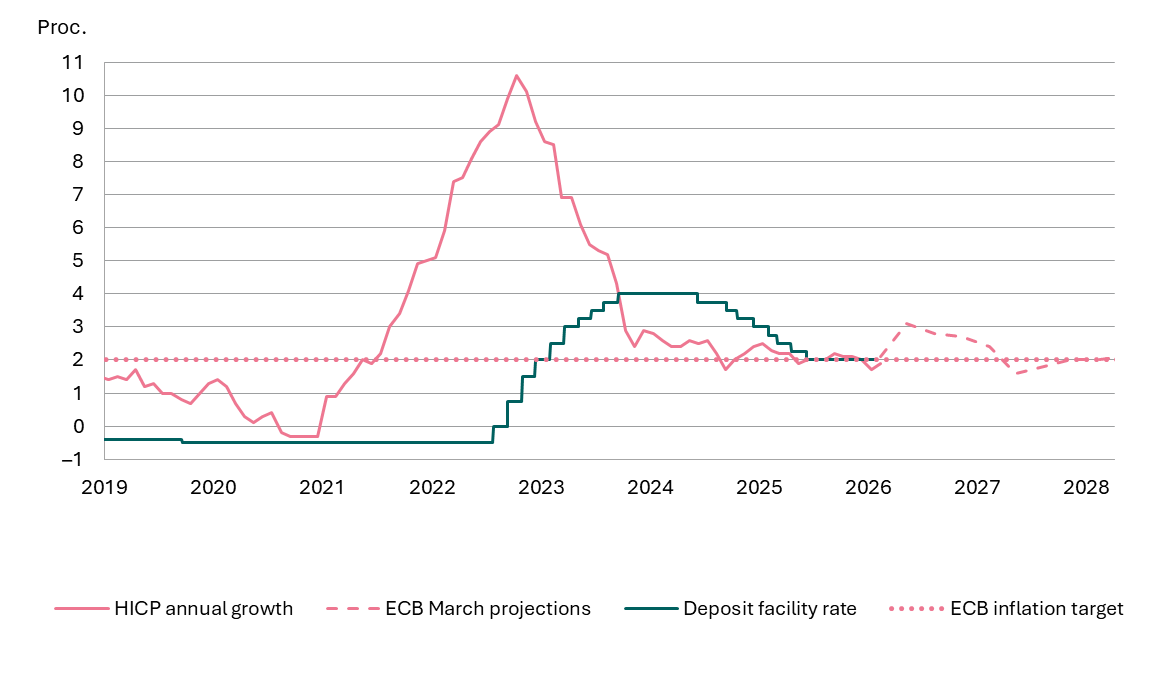
With inflation having declined and moved closer to the 2% target, the ECB Governing Council left the deposit facility interest rates unchanged after its June 2025 meeting. The decisions were taken following an updated assessment of the inflation outlook, development of underlying inflation and strength of the monetary policy transmission. These criteria indicate that inflation should be at the target level of 2% in the medium term. The ECB interest rates remained unchanged following eight cuts over a 12-month period (between June 2024 and June 2025). The main deposit facility rate, having reached 2% in June 2025, was maintained at that level during subsequent meetings in 2025 and January and March 2026. The size of the Eurosystem’s balance sheet continued to decline as securities purchased for monetary policy purposes matured, thereby gradually reducing excess liquidity in the financial system.
Despite a high degree of uncertainty, the euro area economy remained resilient and inflation is close to the ECB target (see Chart 10). Despite trade disruptions and significant geopolitical uncertainty, the euro area economy grew by 1.5% in 2025, even slightly stronger than projected in December (1.4%). The war in the Middle East has significantly elevated uncertainty, heightening higher inflation and downside risks. The March projections of the ECB indicate that annual inflation in the euro area is expected to rise to 2.6% in 2026, before stabilising at around 2–2.1% in 2027–2028. We also expect the euro area economy to grow by 0.9% in 2026, before rising by 1.3% in 2027 and 1.4% in 2028. Nevertheless, the economic environment remains clouded by elevated uncertainty stemming from geopolitical tensions, rising energy prices and potential trade restrictions. The impact of the war on the inflation and economic outlook will depend on the intensity and duration of the war as well as on how energy prices will affect the economy and consumer prices. After assessing the situation, the ECB Governing Council will take decisions at each meeting following a data-dependent approach.
The key ECB interest rates have remained unchanged since June 2025.
Chart 10. Actual data on interest rates and inflation in the euro area and market expectations
Sources: ECB, Eurostat and LSEG.
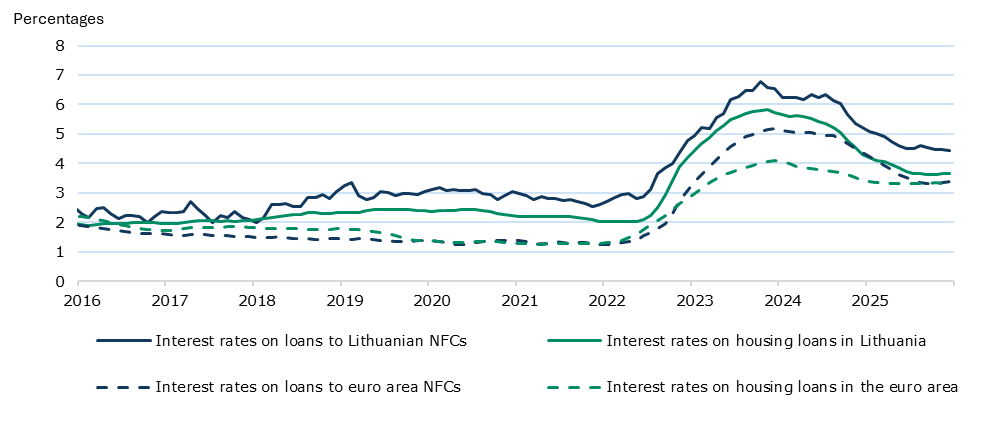
Since the key ECB interest rates have remained stable since June 2025 and the euro interbank offered rate (EURIBOR) virtually has not changed, there have been no significant changes in lending conditions. Throughout 2025, the gap in housing loan interest rates between Lithuania and the entire euro area narrowed from 0.87% in December 2024 to 0.33% in December 2025 (see Chart 11). Nevertheless, loan interest rates in Lithuania remained higher than the euro area average, with the difference in December being 0.34 percentage points for households and 1.05 percentage points for NFCs. This gap may have resulted from the higher concentration of the Lithuanian banking sector and the fact that, historically, almost all housing loans in Lithuania (around 97%) have variable interest rates (usually 3, 6 or 12-month EURIBOR), while the euro area average is much lower (around 18%). In May 2025, when it became mandatory for banks to offer housing loans with both variable and fixed interest rates for at least 5 years, fixed and variable interest rates virtually converged.
In the second half of 2025, financing conditions remained largely unchanged across the euro area and in Lithuania.
Chart 11. Average interest rates on new MFI housing loans and loans to NFCs
Sources: ECB and Lietuvos bankas calculations.
Notes: 3-month moving average. Excluding revolving loans and overdrafts.
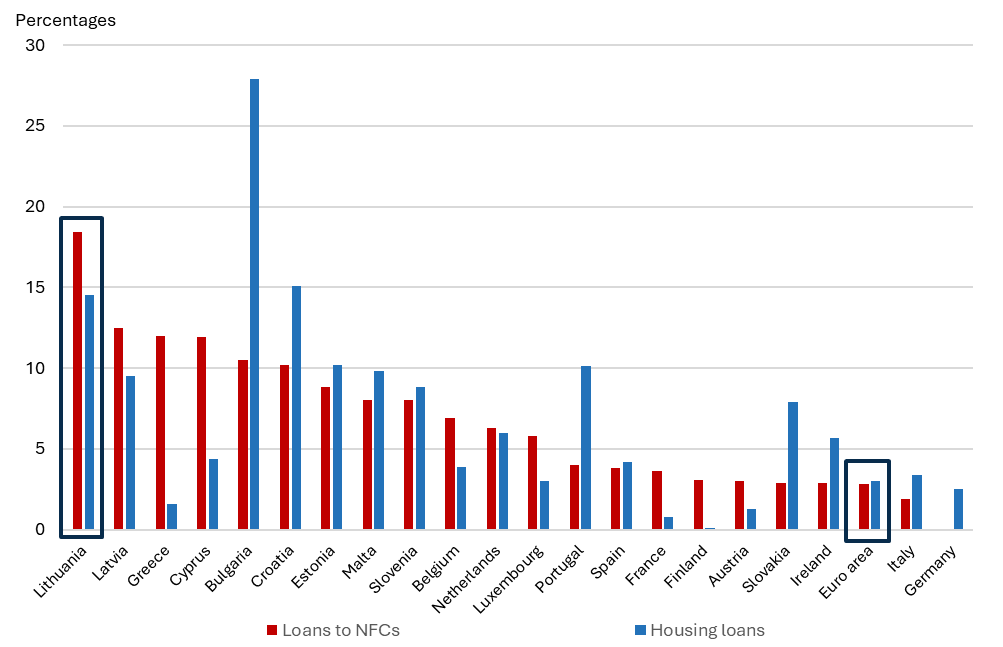
In January 2026, Lithuania recorded the highest annual growth of the NFC loan portfolio in the euro area, while the growth of the housing loan portfolio ranked third (see Chart 12). The corporate loan portfolio increased significantly across all major economic sectors, with the exception of modest growth in the trade sector. With households actively borrowing for both housing and consumption, the volume of new loans to households was nearly 16% higher and to businesses 11% higher in the second half of 2025 compared to the first half. Despite strong lending, the overall debt level remains one of the lowest in the euro area, with the ratio of bank loans received to GDP standing at 39% at the end of 2025 (up by 1.7 percentage points over the six months). Including non-bank financing sources, the credit-to-GDP ratio stood at 67% in the third quarter.
Chart 12. Annual change in MFI loans to NFCs and housing loan portfolio in the euro area countries, January 2026
Source: ECB.
7.General government finance
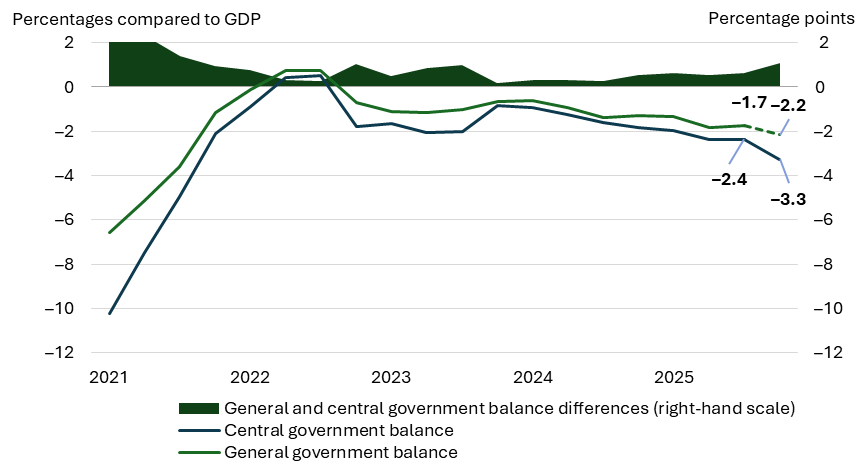
The financial health of general government continued to deteriorate in the second half of 2025, as spending continued to outpace revenues (see Chart 13). Compared to 2024, the general government balance to GDP ratio declined by 0.5 percentage points in the third quarter of 2025 to -1.7% of GDP (measured on a 4-quarter moving sum). Preliminary estimates of Lietuvos bankas, which are based on central government data, indicate that the general government deficit increased by a further 0.4 percentage points in the fourth quarter, meaning that the general government deficit in 2025 could have stood at -2.2% of GDP. The general government deficit observed in the second half of 2025 was at its highest level since the end of the third quarter of 2021, when the general government deficit was large due to higher spending on COVID‑19 pandemic mitigation and more than double the historical average for 2012–2019.
In the second half of 2025, the general government deficit widened further and reached its highest level since the third quarter of 2021.
Chart 13. General government and central government balance development (4-quarter moving sums)
Sources: State Data Agency and Lietuvos bankas calculations.
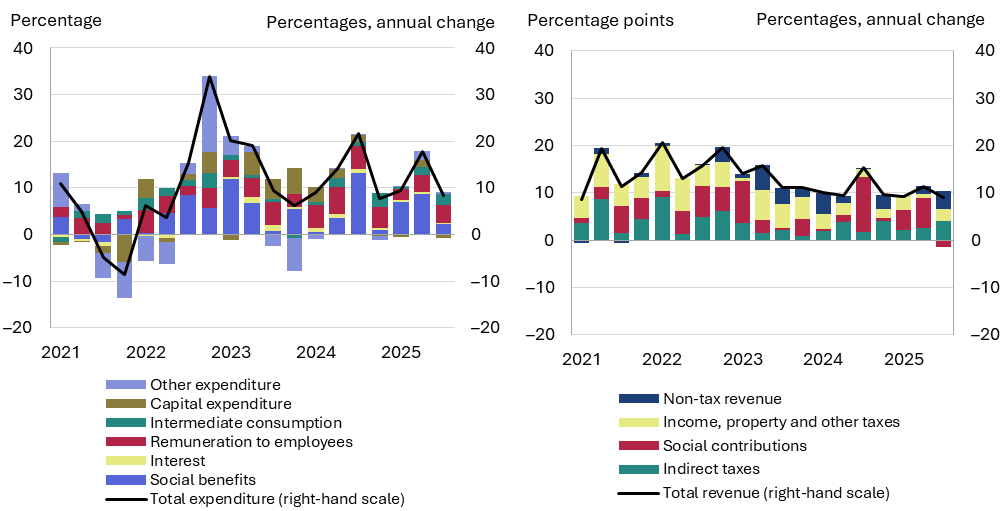
The annual growth rate of general government spending stood at 8.3% in the third quarter of 2025 and is likely to have exceeded 7% in the fourth quarter (see Chart 14, left-hand panel). In the third quarter, the growth of general government expenditure was mainly driven by higher wage costs: as in the previous quarters, wage costs for employees in the education and health sectors continued to grow at the fastest rate. Higher social benefits also contributed significantly to the growth of general government expenditure. The growth of social benefits can be attributed primarily to the increase in the base pension and value of individual pension accounting points at the beginning of the year as well as to the levels of the minimum wage and other indicators (minimum consumption needs, basic social benefits, etc.) used to calculate various social benefits.
General government revenue
continued to grow in the third and fourth quarters of 2025 (by 9.1% and,
likely, 4% respectively) (see Chart 14,
right-hand panel). In the third quarter, tax revenue was the main driver of
growth of general government revenue. Tax revenue grew mainly due to increases
in the macroeconomic values (bases) on which it is collected: the increased
wage bill boosted personal income tax revenue, while rising consumption
supported VAT and excise duty revenue. General government revenue also
increased due to higher non-tax revenue, which can be partly attributed to
transfers of EU investment funds. The negative impact of social contributions
on general government revenue is explained by the high base effect, with social
contributions
increasing significantly in the third quarter of 2025 due to the nature of
statistical accounting of persons insured by the state. Excluding this factor,
social contributions would have grown broadly in line with the social
contribution base, i.e. the wage bill.
Looking ahead, the financial indicators of general government are expected to be similar in 2026 to the figures recorded in 2025, but the impact of increased defence funding will gradually begin to show. At first glance, the general government fiscal situation in 2026 will be similar to that of 2025: the general government deficit, driven by the growing central government deficit and partially offset by surpluses of other general government subsectors (primarily social security funds), will be just fractionally higher than in 2025, will not exceed the Maastricht criterion and will be among the lowest in the EU. However, this general government balance situation is due to the nature of defence spending accounting. With defence commitments going up significantly in 2026, they will be included in the statistics of increasing defence spending and balance of general government in subsequent years only, when the purchased military equipment actually arrives in Lithuania. For this reason, the general government balance calculated according to the official methodology will look better than it would if defence spending were to be included in the accounts on a cash flow basis, i.e. if the central and general government balance were to deteriorate to the same extent and at the same time as the new commitments are undertaken.
In 2025, the growth of general government expenditure was driven primarily by increased spending on employee compensation and social expenditure. Tax revenue was the main driver of growth of general government revenue. In the future, general government expenditure will continue to outpace its revenue, which will widen the general government deficit.
Chart 14. Annual development and contributions of general government expenditure (left-hand panel) and revenue (right-hand panel)
Sources: State Data Agency and Lietuvos bankas calculations.
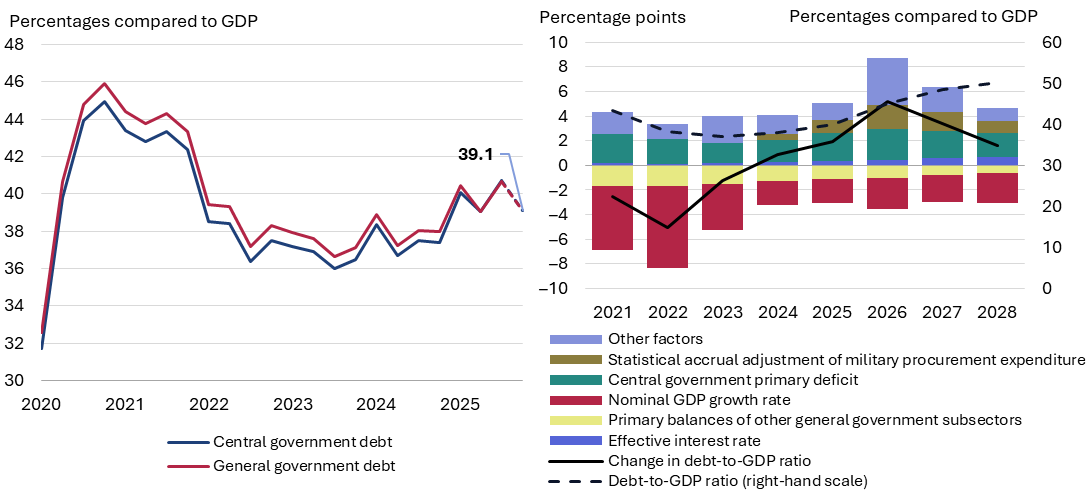
In the second half of 2025, the general government debt level remained similar to that of the first half (see Chart 15, left-hand panel). In the third quarter of 2025, due to positive net borrowing, the general government to GDP ratio temporarily rose to 40.7%. However, according to borrowing and debt repayment statistics of the Lithuanian Government published by the Ministry of Finance, more debt repayment exceeded borrowing by €432 million in the fourth quarter of 2025. This, combined with the continued strong growth of nominal GDP, meant that the general government debt to GDP ratio fell at the end of 2025 to around 39.1%.
Looking ahead, the level of general government debt will go up significantly, mainly due to increasing defence commitments (see Chart 15, right-hand panel). Although all defence spending will be included in the general government balance only in the future, the growing defence commitments financed by advance payments will significantly increase the debt level in the coming years. The growing primary income deficit of central government, resulting from the performance of defence and other government functions, will also continue to contribute to the rising debt level. Only the ongoing surge in nominal GDP and social fund surpluses will keep the debt level from growing at such a fast pace.
At the end of 2025, the general government debt to GDP ratio is likely to have been 39.5%. However, the increasing need for defence funding and continuing growth of central government deficit are expected to contribute to the fast growth of the debt level in the future.
Chart 15. Historical development of the general government debt level (left-hand panel) and projections based on estimates of the Ministry of Finance (right-hand panel)
Sources: Ministry of Finance, State Data Agency and Lietuvos bankas calculations.
Prepared by Vaidotas Tuzikas
The increasing economic activity over the past few years has also affected the number of economic entities operating in the Lithuanian economy. However, there is a consensus in the economic literature that the relationship between the growth of economic activity and the number of businesses is not one-sided but endogenous, as both factors affect one another. Strong economic growth usually means increasing demand for goods and services and improving financing conditions, which is conducive to the creation of new companies and market entry as entrepreneurs seek to capitalise on investment opportunities and improving profitability expectations (E. Kharroubi, 2022). In this way, new and innovative firms increase competition and force less efficient firms out of the market, i.e. resources are reallocated from less productive to more productive activities. From a macroeconomic perspective, the resulting dynamics of firms, i.e. entry, growth and exit, contribute to overall productivity growth as the same resources (e.g. labour, capital, etc.) are deployed in more productive activities. Consequently, empirical studies agree that changes in the number and structure of firms reinforce long-term GDP growth, as the development of aggregate productivity depends not only on the increase in average productivity within existing firms but also on the dynamics of the number of firms (OECD, 2001).
Business entities need a variety of legal forms to establish and grow, as companies differ in size, risk profile, ownership structure, financing needs, etc., and a single universal legal form cannot be effective for all types of activities. Research indicates that throughout a company’s life cycle, different legal forms address the company’s evolving needs related to business risk taking, financing, management and economies of scale. In the early stages of economic activity, simple legal forms with low initial costs (due to a relatively low administrative and compliance burden) facilitate market entry, testing of initial business ideas and search for customers. Once a firm has successfully passed the test of market competition, limited liability legal forms become more attractive as the company continues to grow since they limit personal risk, allow for raising capital from multiple sources, maintain a flexible and simple management structure and facilitate business continuity. This form is most suitable for small and medium-sized enterprises (World Bank). Companies with strong growth potential require more complex governance structures as they seek to raise capital from institutional investors, who place high priority on the guaranteed transferability of ownership rights, corporate governance structure that keeps ownership separate from management and strong investor protection. As empirical studies of corporate governance show, these factors reduce the costs of raising capital investment and are indispensable for continued corporate growth and innovation (La Porta et al., 1996).
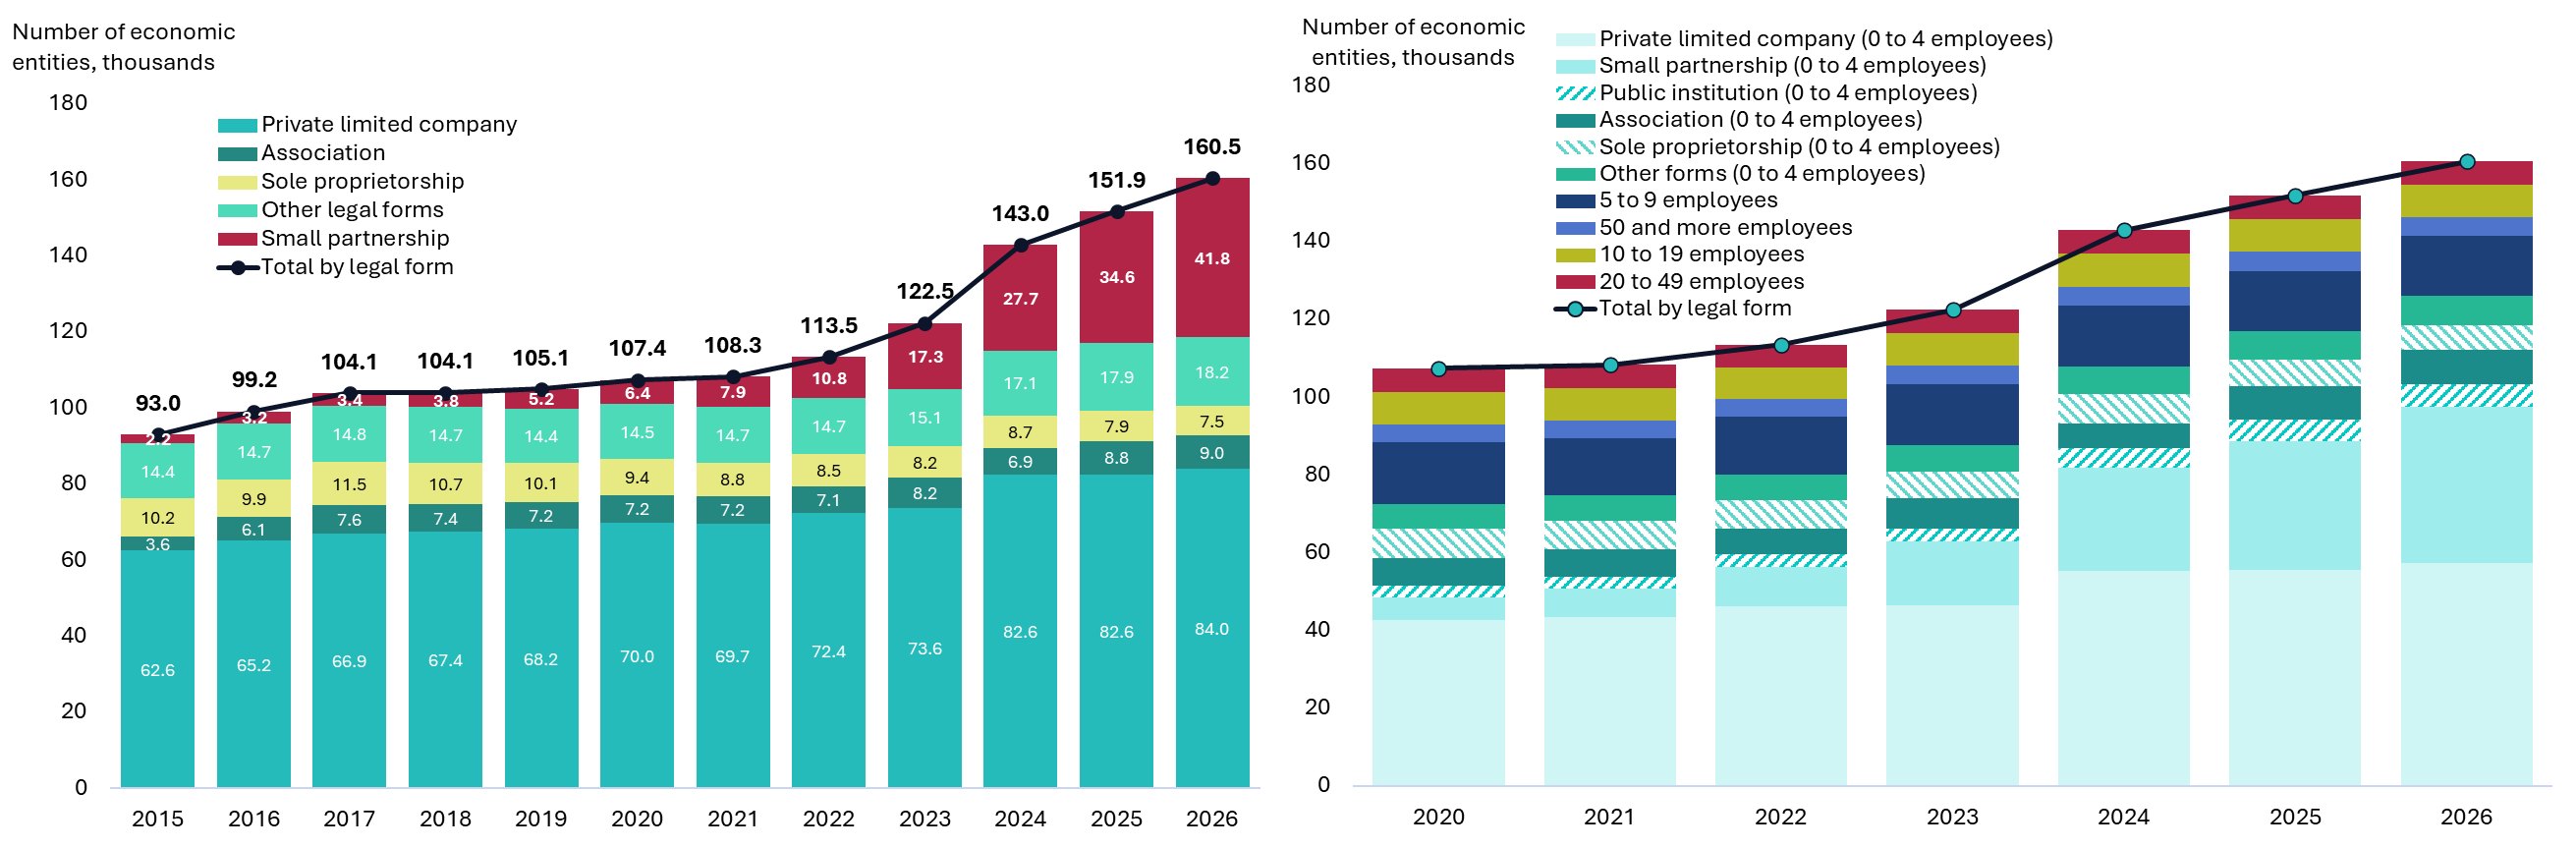
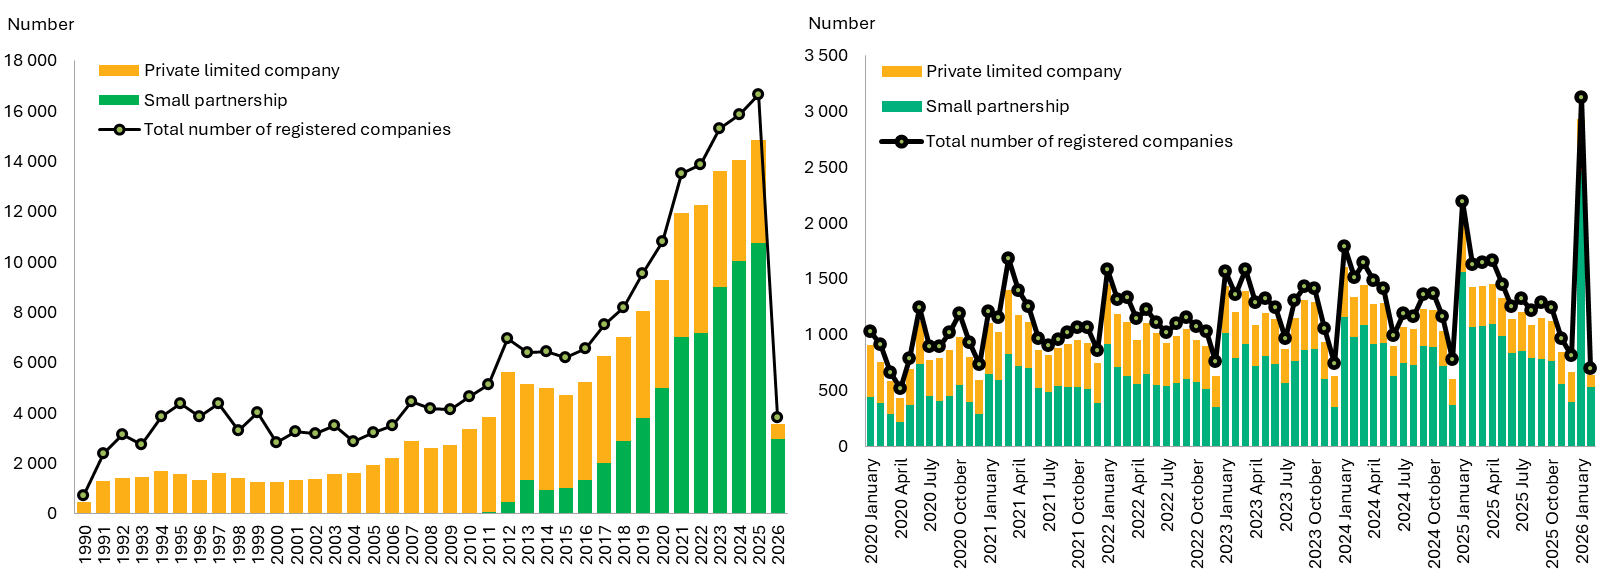
Over the past few years, the number of small partnerships (SPs) increased several times in Lithuania, while the number of other business entities (except for private limited companies) remained largely unchanged over the same period (see Chart A). Small enterprises with up to four employees prevail in Lithuania; on average, they accounted for 72% of all active business entities in 2020–2025. The most popular business forms among small entities with up to four employees were private limited companies and SPs in 2020–2025, although the number of the latter is growing rapidly. Data indicate that private limited companies and SPs accounted for 59% and 8% of all enterprises with up to four employees respectively in 2020, but the share of private limited companies fell 47%, while the share of SPs rose to 28% in 2025. It should be noted that SPs with up to four employees make up the majority of all operating SPs: their share was 95% on average in 2020–2025.
Chart A. Number of economic entities active in Lithuania at the beginning of the year (1 January of the calendar year) (left-hand panel); structure of active economic entities by type of activity and number of employees (right-hand panel)
Sources: State Data Agency and Lietuvos bankas calculations.
Since 2021, more than half of all newly registered legal entities are SPs (see Chart B). Analysis of daily data on the registration and deregistration of legal entities shows that, for a long period following the restoration of independence, the overall growth in the number of registered legal entities in Lithuania was primarily driven by the establishment of private limited companies. However, this trend reversed after the Republic of Lithuania Law on Small Partnerships was adopted in 2012 and the legal business form of SP was created. From 2021 onwards, this legal form became dominant among all newly registered legal entities: it accounted for 65% in 2025 and this share increased to nearly 80% of all newly registered companies during the first months of 2026. The idea behind the legal business form of SP was to fill the structural gap between individual activity and private limited companies, which had long limited the options for small and start-up businesses in Lithuania. Individual activity offered a simple way to start a business but it entailed unlimited personal liability, while a private limited company, although it provided limited liability, required greater administrative, financial and organisational resources, often disproportionate to small-scale operation. The SP was created as a flexible form of a legal entity with limited liability, tailored to small businesses, family businesses or partnerships of several individuals, allowing to start a business without any authorised capital and with simplified management. The aim was to lower barriers to starting a business, promote the formalisation of activities, entrepreneurship and collaboration, while protecting personal assets of entrepreneurs.
The rapid rise in the popularity of SPs is likely due to the flexibility of this business structure, ease of incorporation and limited liability; but there are drawbacks as well. A SP offers significant tax advantages. For instance, SP’s profits may be distributed to its members even before the SP’s financial year ends. Compared to other business forms, the salary of a SP’s manager is taxed at a much lower rate: if the manager is also a member of the SP, their salary is subject to just 15% income tax. State social insurance and compulsory health insurance contributions are paid on half of the amount paid out to a SP member for personal needs, but in practice many SP members do not withdraw funds for personal needs, instead paying themselves compensation for work as a manager’s salary or as a share of profits. However, the SP business form also has certain drawbacks, the most significant of which is the limited ability to raise external investment as investors are often legal entities, whereas only natural persons can be members of a SP. Additionally, in certain cases, it is more difficult for a SP to attract skilled and motivated employees as they tend to view the SP business form with caution and do not consider SPs to be stable and successful companies.
Chart B. Legal entities registered in the Register of Legal Entities: annual data (left-hand panel) and monthly data (2020 to February 2026) (right-hand panel)
Sources: State enterprise Centre of Registers and Lietuvos bankas calculations.
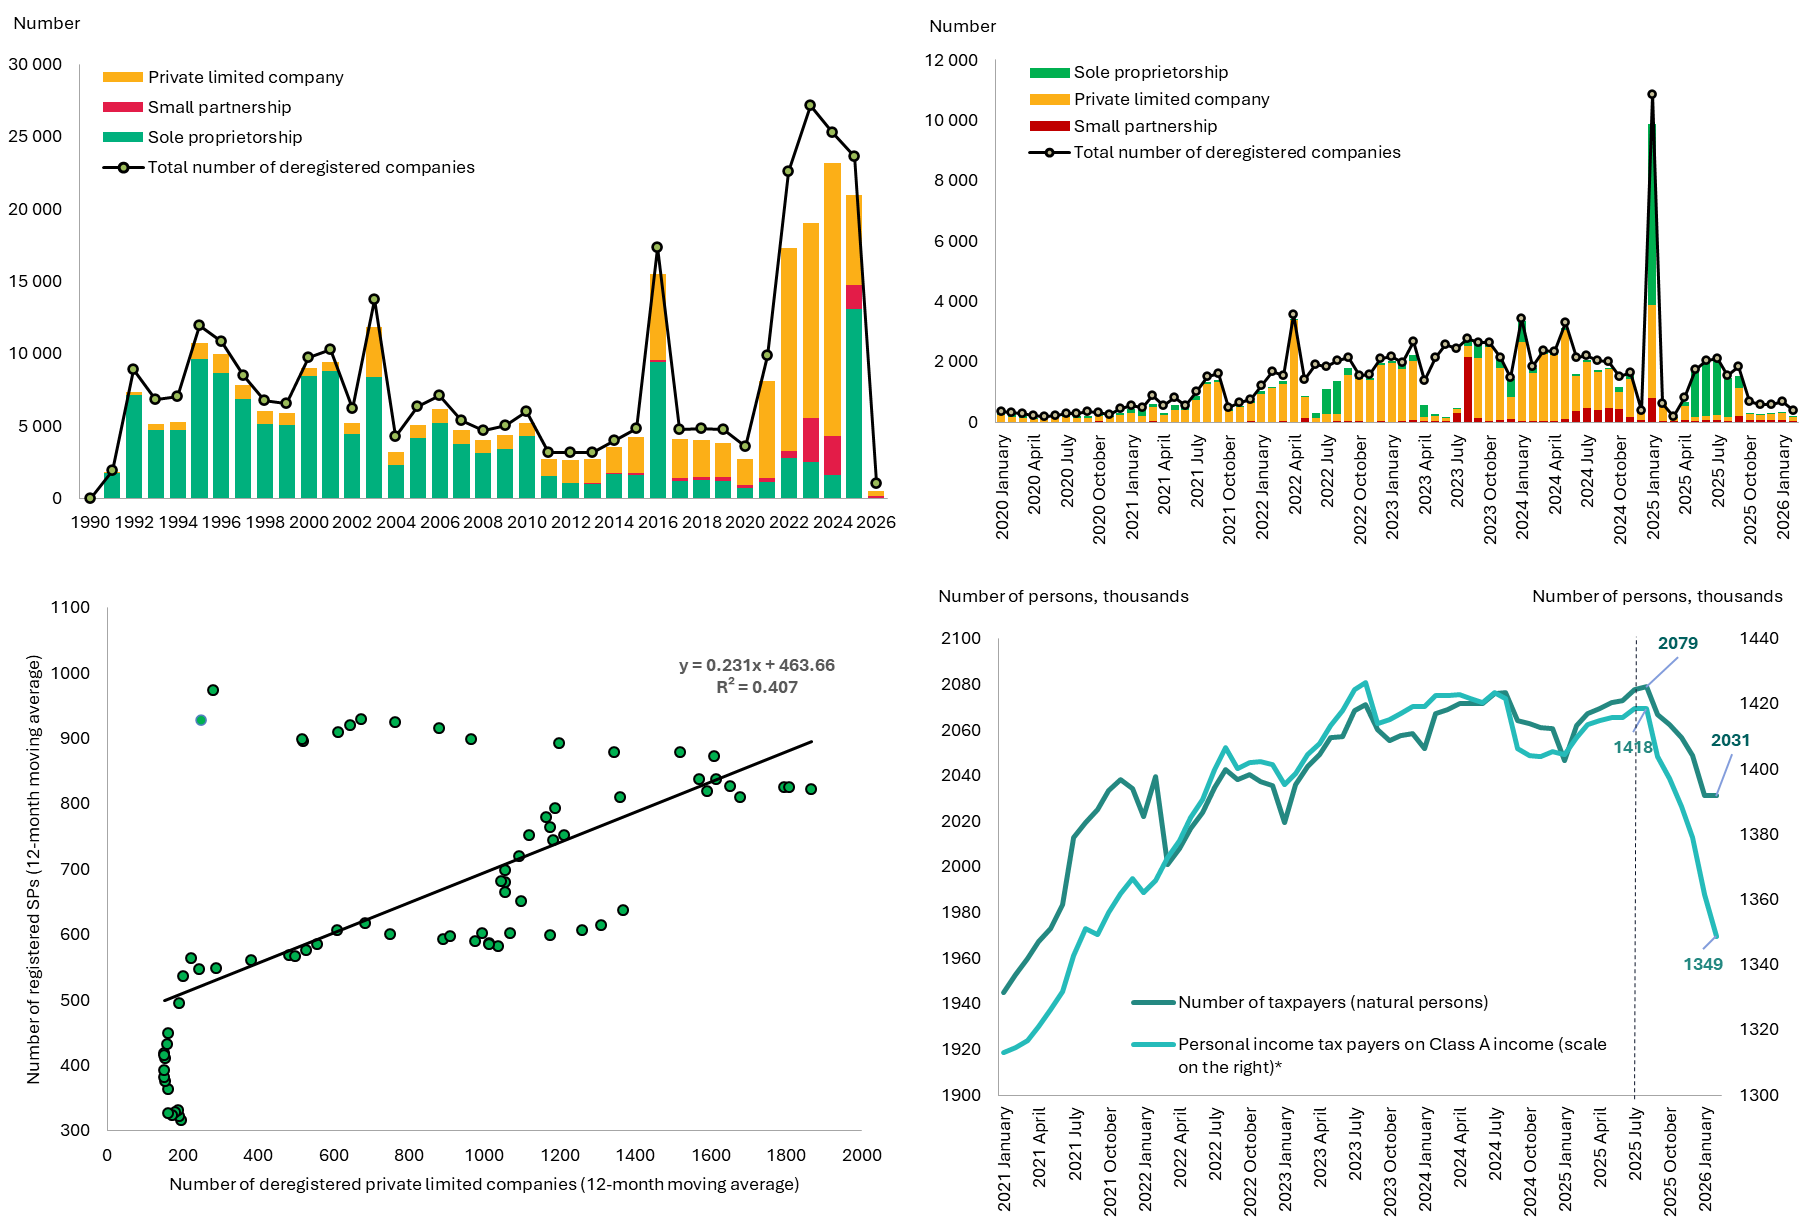
Chart C. Legal entities removed from the Register of Legal Entities (annual data) (left-hand panel), legal entities removed from the Register of Legal Entities from 2020 to January 2026 (monthly data) (right-hand panel), relationship between private limited companies deregistered and SPs registered from 2020 to January 2026 (bottom left-hand panel), number of taxpayers and those paying personal income tax on Class A income (bottom right-hand panel)
Sources: State enterprise Centre of Registers, State Tax Inspectorate and Lietuvos bankas calculations.
* Note: Taxpayers are not unique; for instance, the same person may be employed under an employment contract and also engage in individual activity.
The significant increase in the number of newly registered SPs at the beginning of 2026 is potentially related to behaviour aimed at optimising the tax burden for businesses, which is not rational from a macroeconomic and fiscal perspective, as it significantly undermines the effectiveness of efforts to increase tax revenue. Studies have found that Lithuanian companies respond to changes in the tax system and adjust their behaviour to take advantage of more favourable tax conditions. The World Bank study showed that Lithuanian companies have incentives to plan their reported turnover and growth so that they remain below the income threshold for an extended period, since exceeding that threshold triggers the obligation to apply the standard corporate income tax rate (17% instead of the preferential 7%). This means that, from a microeconomic perspective, companies optimise their tax burden and plan their reported turnover and growth in a way to reduce it. Nevertheless, this is not rational from a macroeconomic and fiscal perspective as it significantly reduces the effectiveness of efforts to increase tax revenue which is needed to cover greater spending needs. For instance, tax amendments approved in June 2025 were intended to sustainably increase tax revenue used to finance the Defence Fund. Perhaps the most significant of these are the introduction of the progressive 25% income tax rate, application of uniform income tax rates to different types of income (with a few exceptions) and a 1 percentage point increase in corporate income tax rates. Therefore, it cannot be ruled out that the significant increase in the number of newly registered SPs at the beginning of 2026 confirms earlier warnings from the business community that the approved tax amendments would prompt businesses to change their business form or legal status in order to optimise their tax burden and avoid higher taxes. Such reactions are consistent with the general conclusion in tax policy literature that inconsistent tax rules, redundant forms of business, etc. enable economic entities to ‘adapt’ by choosing the structure of their reported income and/or legal form, making this an important dimension that policymakers must consider in order to create a stable and effective tax system.
Abbreviations
GDP gross domestic product
CG central government
OECD Organisation for Economic Cooperation and Development
ECB European Central Bank
EC European Commission
EU European Union
Eurosystem European Central Bank and euro area central banks
PIT personal income tax
IT information technology
USA United States of America
MMW minimum monthly wage
NEER nominal effective exchange rate
TEI tax-exempt income
RE real estate
CIS Commonwealth of Independent States
MFI monetary financial institution
VAT value added tax
HICP Harmonised Index of Consumer Prices
IMF International Monetary Fund
UAB private limited liability company
SDA State Data Agency
AW average wage
GG general government
|
© Lietuvos bankas, 2026 Gedimino pr. 6, LT-01103 Vilnius The Lithuanian Economic Review analyses the developments of the real sector, prices, public finance and credit in Lithuania, as well as the projected development of the domestic economy. The material presented in this review is the result of statistical data analysis, modelling and expert assessment. The review is prepared by Lietuvos bankas. The cut-off date for the data used in the publication is 11 March 2026, except for information on monetary policy decisions. Reproduction for educational and non-commercial purposes is permitted provided that the source is acknowledged. ISSN 2029-8471 (online) |