
Summary
With trade and other geopolitical tensions escalating, the risk of shocks that could adversely affect economic development and financial stability has been elevated. The record-high uncertainty surrounding US tariffs on imports of goods, their size, scope, and potential impact on both the economy and financial stability led to significant volatility in global financial markets in March and April 2025. At the same time, potential new tariffs, disruptions to international trade, and the resulting unexpected shocks could have a negative effect on the economic development and financial stability of countries. This uncertainty may dampen economic growth in the euro area, but the Lithuanian economy remains resilient, and the risk of a more significant economic downturn is mitigated by the fact that Lithuania’s direct dependence on trade with the USA is relatively lower than that of other countries.
Amid economic uncertainty and trade tensions, Lithuania’s private sector, especially companies, may face financial deterioration which could weaken their ability to repay debt, thereby posing the main risk to the country’s financial stability. Although companies have so far managed to remain resilient, trade tensions could significantly weaken the financial situation of manufacturing, transport, and trade businesses directly and indirectly exposed to US import tariffs, and thus their ability to meet their financial obligations. Credit risk is limited by the small share of loans to manufacturing subsectors directly affected by US import tariffs in the total corporate loan portfolio, while the risk of non-repayment in sectors sensitive to a decline in overall export demand is mitigated by low levels of indebtedness, good loan quality, and a low loan-to-value ratio. However, due to interlinkages, losses could spread to other companies and negatively affect financial stability and economic development in Lithuania. Although the purchasing power of households has continued to grow recently and households have remained financially resilient due to the favourable labour market situation and rising wages, if companies encounter difficulties, lay-offs could increase, wages could fall, and the financial situation of households could deteriorate significantly.
In an environment of falling interest rates, credit demand has increased, leading to more borrowing by households and businesses; however, the role of credit institutions in lending to businesses has remained weakened. Following a phase of rising interest rates in 2022–2023, when the number of housing loans granted to households, especially those with lower incomes and secondary housing buyers, declined significantly, there are now signs of recovery. With borrowing conditions improving and household incomes rising, demand for loans, especially for housing and consumption, has increased. The dynamics of corporate lending are different: although the corporate loan portfolio is growing at a fairly rapid pace, businesses continue to face challenges in accessing finance. A survey of enterprises conducted by Lietuvos bankas indicates that approximately one in three companies had their loan applications rejected in 2024, with this figure even higher for micro and small enterprises, and around 17% of the companies surveyed believe that access to credit from credit institutions is completely restricted. High collateral requirements and a lack of assets suitable for collateral limit access to credit for companies and remain pressing concerns, especially for micro and small enterprises. In addition, the decisions of credit institutions to reject loan applications are often a result of the unsatisfactory financial situation of applicant companies and the reduced risk appetite of banks. For these reasons, businesses tend to turn to alternative sources of financing, with the national development bank UAB ILTE playing an increasingly important role.
Risks in the housing market have subsided, but they remain elevated in the commercial real estate (CRE) segment due to oversupply in the office segment and ongoing debt refinancing risks. With borrowing costs falling and affordability improving, activity in the housing market continues to pick up. As the risk of house price correction failed to materialise, the risk of supply shortages has become more relevant in the medium term, which may lead to an increase in house price overvaluation in the long run. Falling borrowing costs reduce the level of risk in the CRE segment, while lower price imbalances lead to more positive expectations among market participants regarding future market developments. On the other hand, the level of risk remains elevated as the profitability of real estate managers continues to be negatively affected by high debt servicing and refinancing costs, while growing office vacancies are putting downward pressure on property prices. However, with banks lending only to the safest CRE projects, the quality of the CRE portfolio is good.
The average liquidity, asset quality, and profitability ratios in the banking sector were among the best in the EU in 2024, but the performance of the largest banks was significantly better than that of smaller banks and the risk of systemic cyberattacks remained elevated. The high profitability level in the banking sector was supported by the still high net interest income of banks, but a relative increase in operating expenses was also observed. Meanwhile, the level of non-performing or impaired loans in the banking sector remains low. Stress testing of the banking sector’s solvency and liquidity conducted by Lietuvos bankas indicates that the sector remains resilient to a deterioration in economic developments or unexpected liquidity shocks of varying durations. Capital depletion under an adverse scenario does not pose a risk to the stability of the sector, while the sufficient level of liquid assets ensures the sector’s strong liquidity position. The risk of cyberattacks remains one of the most important risks for the banking sector, and particular attention is being paid to managing this risk by strengthening cooperation at both the national and international levels and increasing the investments of financial institutions in the protection of IT systems.
The non-banking sector in Lithuania is growing steadily, with significant growth in pension and investment funds and the insurance and credit union sectors. With the fintech sector continuing to expand, the key challenge remains the supervision of higher-risk customers and preventing the evasion of sanctions. Although both assets and deposits raised by credit unions grew last year, strengthening capital and increasing resilience to shocks remain a priority. The growth of pension funds was driven by successful investments and the more active involvement of new participants, but changes to the system under consideration may affect the further development of the sector. In the fintech sector, the drop in the number of market participants is offset by the expansion of existing companies in the sector. In the current volatile geopolitical context, the responsible supervision of higher-risk customers and their payments and the prevention of possible violations is particularly important. Meanwhile, the crypto-asset sector is undergoing a transition period as the licensing process under the new MiCA Regulation requirements is underway. The limited interconnectedness between non-bank institutions and the banking sector helps manage risks to the financial system.
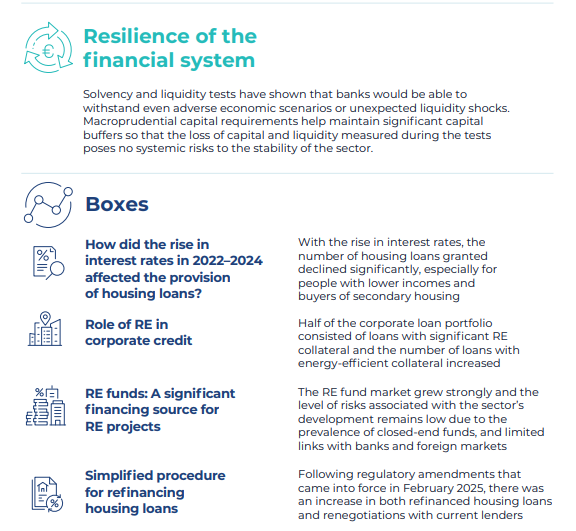
The macroprudential measures in
place contribute to the resilience of the Lithuanian financial system, while
the amendments to the legislation that were initiated by Lietuvos bankas and have
since entered into force ensure that consumers are actually able to choose and
improve the terms of their housing loans. The
broad set of macroprudential measures applied and regularly reviewed in
Lithuania increases the resilience of banks to unexpected shocks and protects
consumers from excessive financial liability burdens. Amendments to the
Republic of Lithuania Law on Real Estate Related Credit which entered into
force in 2025 increased the ability of consumers to choose the most favourable
housing loan terms and fostered greater competition among lenders. Since 1 February,
individuals have been able to refinance their existing housing loans under a
simplified procedure, which has made the refinancing process faster and, in
most cases, free of charge. These regulatory changes have led to a significant
increase in both the number of housing loans refinanced with a lower margin and
the number of renegotiations with the current lender. In addition, since
1 May, lenders have been obligated to provide each customer with at least
two interest rate options, i.e. a variable rate and a fixed rate for at least
five years, to ensure that consumers can choose the product that suits them
better.
1.Status, risks and resilience of the financial system
1.1.Development of the Lithuanian and international macroeconomic environment and financial markets
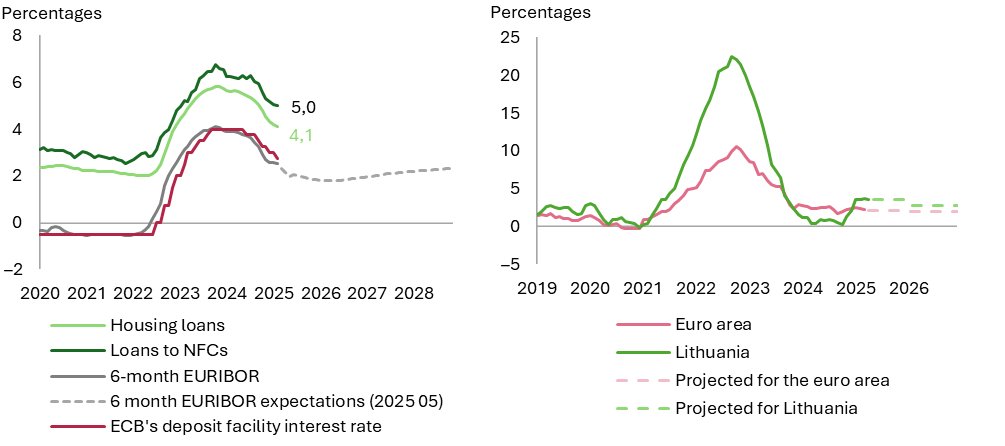
With inflation in the euro area declining towards 2% and the ECB cutting deposit facility and other interest rates, interest rates on new loans to non-financial corporations as well as on housing loans continue to fall.
Chart 1. Loans to the private sector in Lithuania, 6-month EURIBOR and ECB’s deposit facility rates (left-hand panel) and annual inflation in Lithuania and euro area (right-hand panel)
Sources: Lietuvos bankas, ECB, IMF, and Chatham Financial.
Notes: Interest rates on housing loans and loans to non-financial corporations are calculated using a 3-month moving average. Dotted lines indicate the market expectations of Chatham Financial on the left-hand panel and the projections of the ECB and Lietuvos bankas on the right-hand panel.
Trade tensions and related uncertainty can have a negative impact on the stability of the financial system through the channels of businesses, the banking sector, and financial markets. The corporate sector may be affected through the lower profit margins or even losses of exporting firms and possible difficulties in honouring existing financial liabilities. Lower corporate credit quality would lead to higher provisioning costs for the banking sector and a contraction in lending to the real economy. These effects could materialise in the short to medium term, with financial markets responding most strongly to the uncertainty of US trade policy. The announcement of higher-than-expected US import tariffs had a significant impact on the turbulence in global financial markets in March and April 2025.
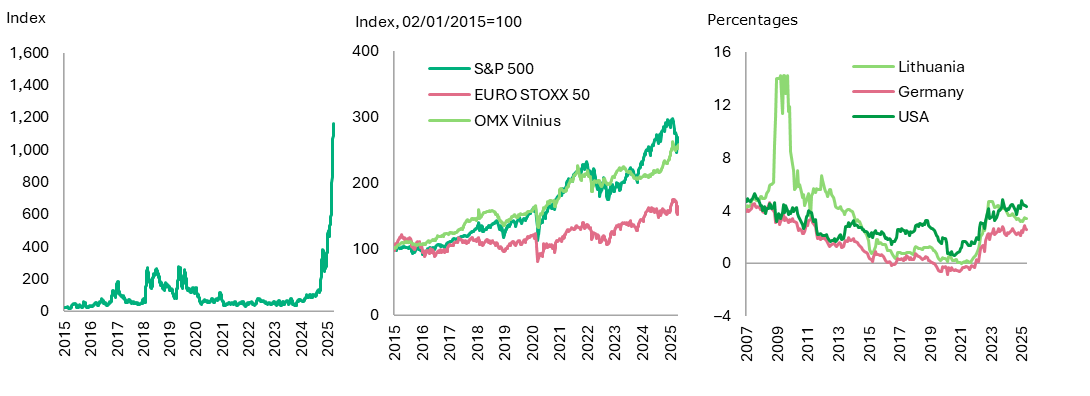
Uncertainty and volatility are still high in global financial markets, especially in response to news from the USA. The tariffs announced by the US President at the beginning of April 2025 have created unprecedented uncertainty in the financial markets, prompting market participants to sell off even the safest of instruments, such as US government securities, and the US dollar has depreciated significantly. The S&P 500 fell by 16% in the two months before the beginning of April and the EURO STOXX 50 fell by 8%, while the OMX Vilnius was more resilient (see Chart 2, central panel). It should be noted that equity markets have rebounded slightly following the US President’s change of rhetoric on trade tariffs (the S&P 500 was already down 9% on 28 April and the EURO STOXX 50 down less than 6% from their peak in mid-February, see Chart 2, central panel). Increased geopolitical and trade policy uncertainty is also present in bond markets. Bond markets saw yields rise in the first months of 2025, with particularly strong growth in Europe, where they rose at a record pace following Germany’s announcement of major defence spending plans, including a €500 billion fund to develop its defence capabilities. It should be noted that in the first three months of this year, German government bond yields increased by around 51 basis points, while Lithuanian yields rose by 27 basis points. In contrast, yields of US 10-year debt securities have grown more moderately (by around 21 bps in the first three months of 2025). It should be noted that bond yields in Europe declined in April (the yields of Lithuanian and German 10-year government securities declined by 27 and 26 bps, respectively, during April) as investors looked for safe asset alternatives to US bonds, whose volatile yields reflect the uncertainty of US policy.
The Trade Policy Uncertainty Index has reached historical highs, with significant volatility in financial markets as a direct result.
Chart 2. Trade Policy Uncertainty Index (left-hand panel), stock indexes (central panel), and yields of 10-year government securities (right-hand panel)
Sources: Trade Policy Uncertainty Index, London Stock Exchange Group, and Lietuvos bankas.
Note: Central and right-hand panels: share values and values of indexes of government securities yields on 28 April 2025.
Left-hand panel: Values of the Trade Policy Uncertainty Index as of 2 May 2025. The index measures the total monthly share of the number of articles in seven US newspapers referring to trade policy uncertainty (100=1%).
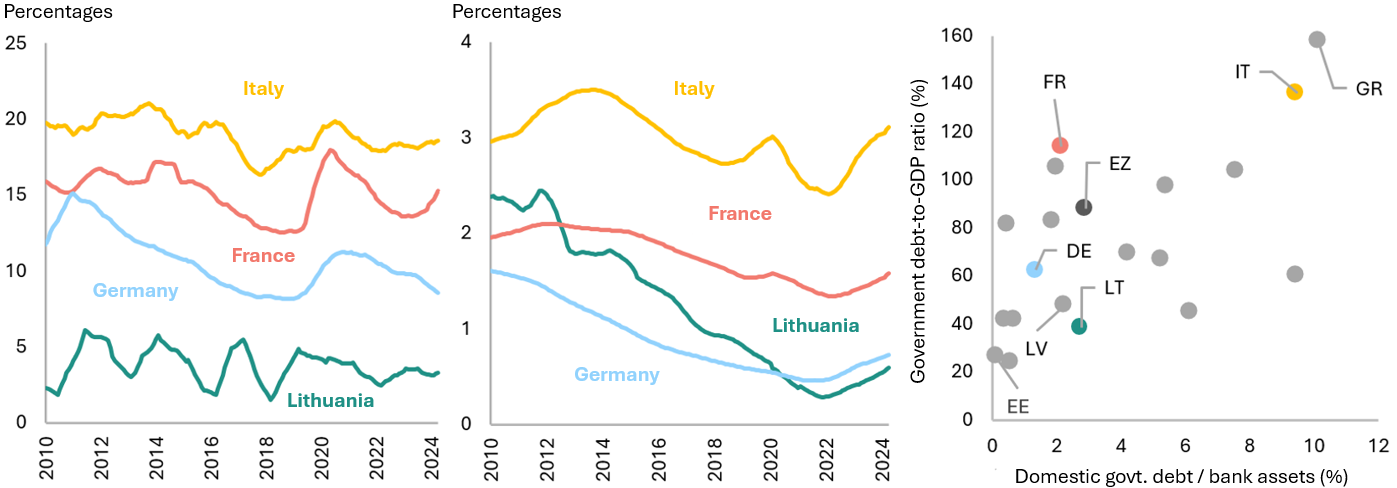
Although the cost of servicing Lithuania’s public debt is expected to rise in the near future due to high borrowing costs and rising defence spending, the low level of indebtedness mitigates the risk of debt unsustainability. With the decline in key interest rates, the yields of Lithuanian 10-year government bonds declined slightly over the year to 3.4% in April 2025 (down from 3.6% year on year and from 4.1% in April 2023). In addition, the risk premium required by lenders due to Lithuania’s geographical proximity to the aggressor countries has almost disappeared as the yield spread between Lithuanian and German 10-year government bonds fell to 85 basis points (down from 170 in April 2023, while the average in 2015–2021 was 80 bps). On the other hand, the cost of borrowing remains relatively high (see Chart 2, right-hand panel) and refinancing existing liabilities makes debt servicing costlier. Nevertheless, the challenges of debt management are mitigated by the low level of indebtedness. Lithuania’s sovereign debt remains one of the lowest in the euro area, resulting in significantly lower debt servicing costs, with annual debt principal and interest payments amounting to 4.3% and 0.7% of GDP, respectively (see Chart 3, left-hand and central panels), compared to the euro area average of 11.6% and 1.5% of GDP, respectively.
Financial links between Lithuanian banks and the public sector are limited, so the risk to financial stability from government defaults or a decline in the value of liquid assets is low. Financial links between banks and the Lithuanian public sector are low by historical standards: in the third quarter of 2024, Lithuanian sovereign debt accounted for 2.8% of total bank assets, whereas in 2013–2016, the linkages were twice as high, and in 2004–2005, they were three times higher. The current level of exposure is broadly in line with the euro area average and significantly lower than, for example, in Italy and Greece, where domestic government debt account for around one-tenth of bank assets (see Chart 3, right-hand panel). In addition to Lithuanian sovereign bonds, Lithuanian banks have also accumulated smaller but still significant (1% of assets) positions in the government debt of other Baltic countries. In the event of geopolitical escalation in the region, this could increase the losses of banks operating in Lithuania. On the other hand, the vast majority of sovereign debt held by Lithuanian banks are held to maturity, so only banks that are more engaged in trading it on the secondary market are exposed to revaluation risks.
Compared to the major euro area countries, the financial links of banks operating in Lithuania with the domestic government sector are not significant, and the cost of public debt servicing is among the lowest.
Chart 3. Ratio of public debt principal (left-hand panel) and annual interest payments (central panel) to GDP, bank links to the public sector and sovereign indebtedness in the euro area (right-hand panel)
Source: ECB Statistical Data Warehouse.
Notes: The right-hand panel shows data for the third quarter of 2024, the left-hand and central panels show 12-month moving averages. In the right-hand panel, domestic debt is deemed to be the liabilities of the general government of the country of establishment to the banks operating in that country.
1.2.Credit and indebtedness development
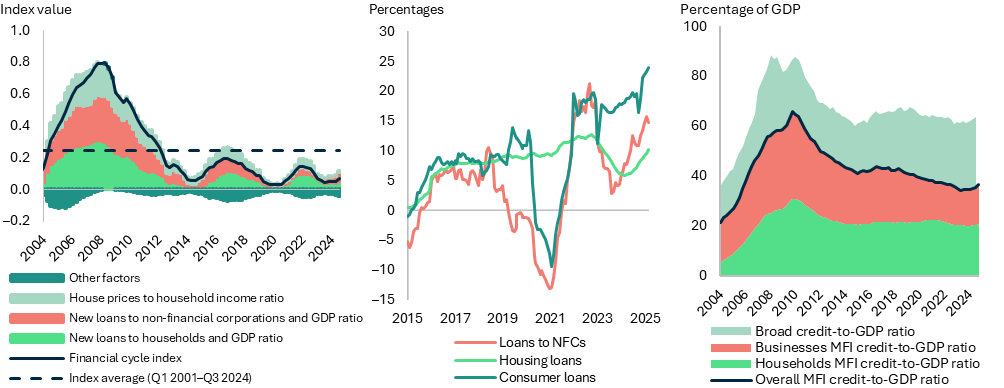
The improving financial situation of households and more favourable borrowing conditions led to an increase in demand for loans and the faster growth of lending to households. Along with rising real incomes and a more favourable situation on the housing market, lending standards eased and demand for loans to households increased. Lower margins on new housing loans (averaging 1.5% in March 2025) encouraged residents to negotiate more favourable terms for their existing loans. With the entry into force of changes to simplified housing loan refinancing in early 2025, the number of housing loans refinanced increased sevenfold in March compared to January, and renegotiation flows reached a record high of €374 million, i.e. four times more than the average monthly renegotiation flows in 2024 (€94 million, see Box 4 for more details).
As new lending accelerates, the financial cycle is gradually moving into a growth phase, and with household and corporate debt remaining at low levels, there are still no signs of excess lending.
Chart 4. Lithuania’s MFI credit-based financial cycle index and its composition (left-hand panel), annual change in the portfolio of MFI loans (central panel), and structure of the ratio of credit in Lithuania to annual GDP (right-hand panel)
Sources: State Data Agency and Lietuvos bankas.
Notes: The left-hand panel shows the ratio of new loans to households to GDP, which is calculated excluding the impact of loan renegotiation as from the second quarter of 2024; the central panel shows the consumer loan portfolio calculated excluding the impact of the Lithuanian branch of TF Bank; the right-hand panel shows broad credit, which includes all credit issued to businesses and households regardless of the credit provider.
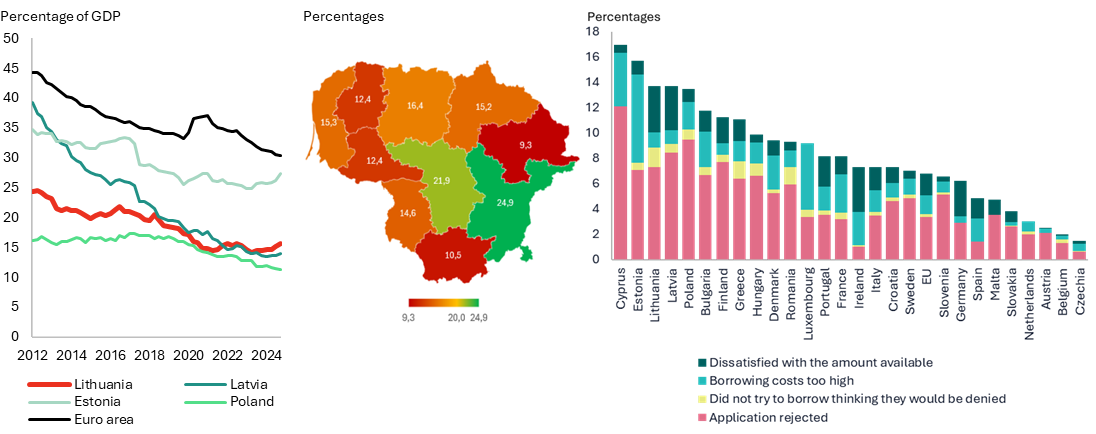
The number of companies with loans from credit institutions remained unchanged, with most loans granted to companies registered in the counties of Vilnius and Kaunas. With the average loan amount increasing, the flows of new loans to companies continued to grow (annual change of 5%), but the number of companies with loans from credit institutions remained largely unchanged in 2024 and stood at around 25,000. The majority of all corporate loans (76% of the portfolio) were issued to companies registered in the counties of Vilnius and Kaunas, and both counties stand out significantly from the others in terms of the ratio of the loan portfolio to the gross value added created in the county (their average is 24%, while that of other counties is 14.2%, see Chart 5, central panel).
The volume of bank credit provided to non-financial corporations remains low compared to Lithuania’s economic growth, and companies are facing difficulties when seeking to borrow from credit institutions. The banking sector’s risk appetite when lending to companies has declined significantly over the last decade. Moreover, businesses MFI credit-to-GDP ratio has fallen by a quarter since 2014 and is one of the lowest in the euro area (16% compared to around 31% for the euro area as a whole, see Chart 5, left-hand panel). A survey of enterprises conducted by Lietuvos bankas indicates that approximately 34% of companies had their loan applications rejected in 2024, with this figure even higher for micro and small enterprises (40% and 37%, respectively). Additionally, around 17% of the companies surveyed believe that access to credit from credit institutions is completely restricted. Loan applications are more frequently rejected for smaller companies, those that have been operating for a shorter period of time, as well as loss-making companies and those that assess their financial situation as being poor. It should be noted that the share of loan applications rejected for companies that approached three or more lenders was almost 50% lower than those who did not. A survey by the European Investment Bank indicates that the share of finance-constrained companies in Lithuania remains among the highest in the EU (see Chart 5, right-hand panel), with smaller companies more often reporting that they did not seek external finance as they thought borrowing costs would be too high or that they would be turned down.
Compared to the euro area average and in terms of gross value added in counties, there is still room for growth in business financing in Lithuania, while the share of finance-constrained companies remains among the highest in the EU.
Chart 5. Ratio of the portfolio of MFI loans to NFCs to annual GDP in euro area countries (left-hand panel), ratio of the portfolio of corporate loans to gross value added in Lithuanian counties (central panel), and comparison between the shares of finance-constrained companies in Lithuania and the EU (right-hand panel)
Sources: European Investment Bank 2024 survey, State Data Agency, and Lietuvos bankas.
Notes: The central panel shows the estimated corporate loan portfolio as a percentage of gross value added. The right-hand panel shows finance-constrained companies, including the following: those that are dissatisfied with the amount of finance obtained; those that sought external finance but did not receive it (application rejected), and those that did not seek external finance because they thought borrowing costs would be too high or that they would be turned down (did not try to borrow because they believed that they would not be financed).
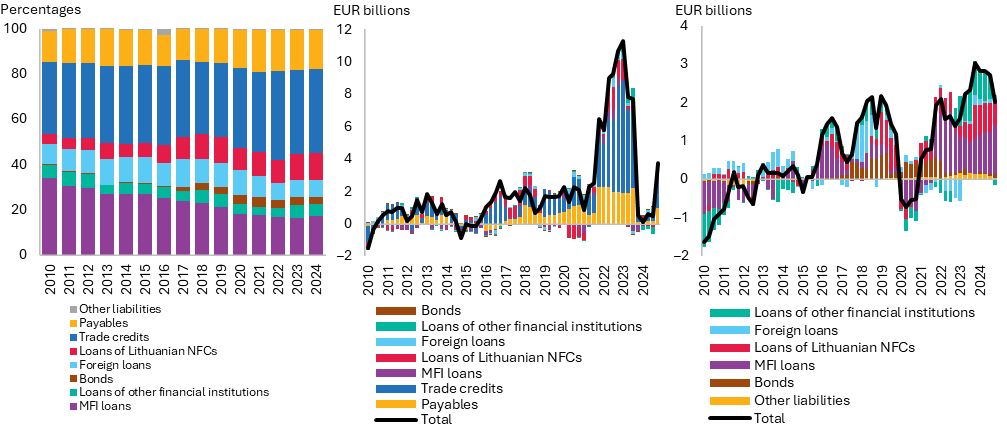
Companies actively borrowed for both the short and long term and also sought alternatives to traditional financing via MFI loans.
Chart 6. Structure of liabilities of NFCs (left-hand panel), annual change in short- (central panel) and long-term (right-hand panel) financial liabilities
Source: Lietuvos bankas.
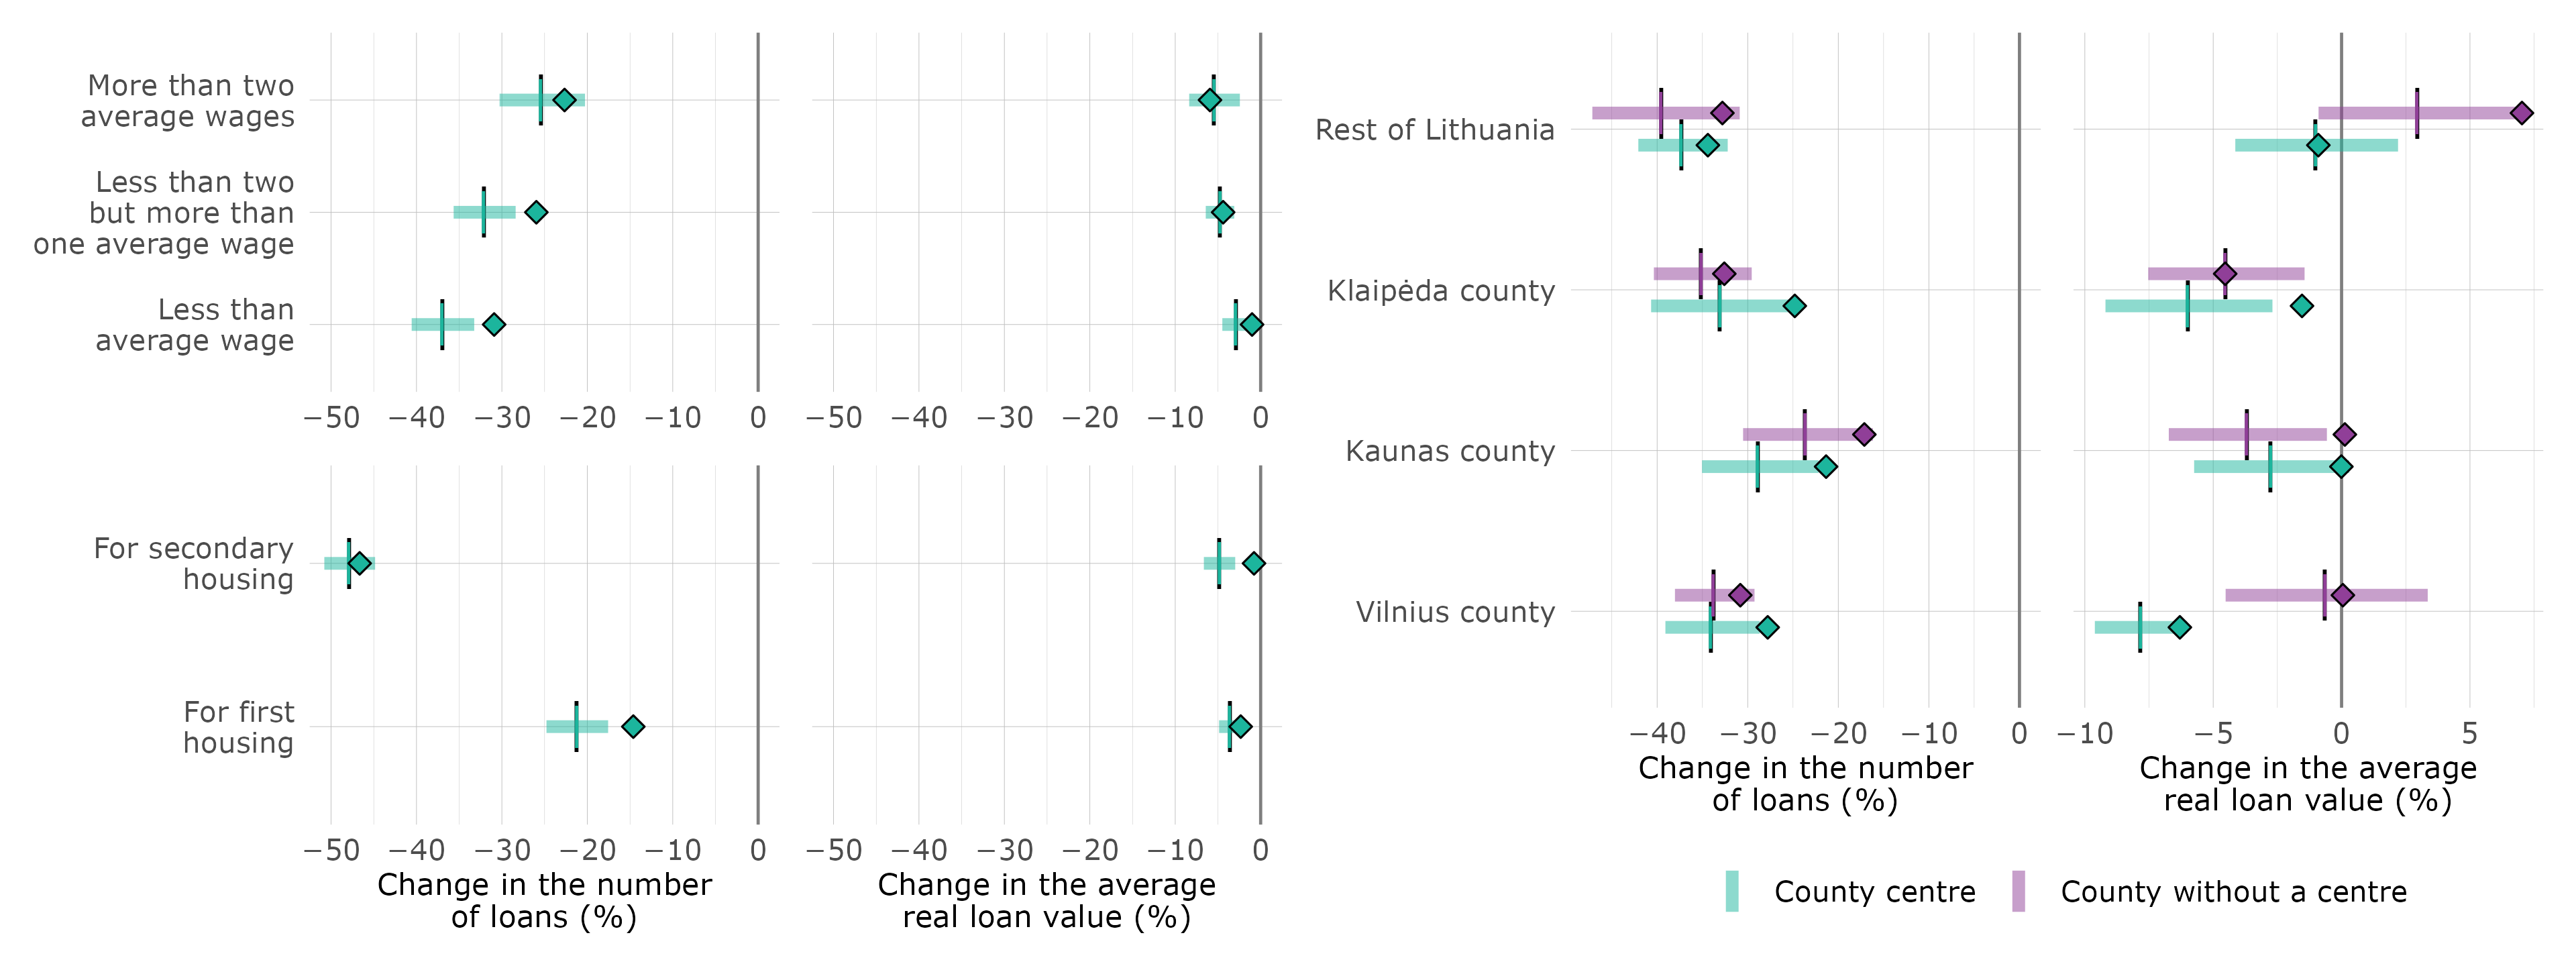
Although the change in the real loan value was similar across all household income groups, the number of loans issued to lower income earners contracted slightly more (see Chart A, top left-hand panel). In the high interest rate environment, individuals earning below the average wage received 31% fewer loans than in the same period before the interest rate increase. Households with above-average incomes experienced a smaller contraction of around 26%. People earning more than two average wages were least affected by the rise in interest rates (23%). This difference was statistically significant even when other factors, such as household composition and the geography of loan collateral, were taken into account. One of the most important reasons for this was likely the 69% increase in average monthly housing loan payments due to a rise in interest rates. With debt servicing costs rising significantly, some of the lowest-income households may have decided to postpone taking on new debt in the high interest rate environment. At the same time, some households that had intended to take out a loan were likely unable to meet the requirement of a maximum of 40% DSTI, which became more restrictive as interest rates rose.
With the rise in interest rates, the number of housing loans granted declined significantly, especially for people with lower incomes and buyers of secondary housing, with significant differences in the real average loan value in some regions.
Chart A. Actual and model-estimated changes in the real loan value and number of loans by household income group and purpose of loan (left-hand panel), and geographic location of loan collateral (right-hand panel)
Source: Lietuvos bankas’ calculations.
Notes: Diamonds in the panels show actual changes in the respective groups, vertical lines show model estimates, and horizontal bars show the 95% confidence band for the estimates.
The number of loans granted decreased by a similar amount (around 30%) in all counties of Lithuania following the increase in interest rates, but there were statistically significant differences in the real average loan values in some regions of the country. For instance, in the city of Vilnius, the average loan value of households at constant prices fell by 7%, although no significant changes in value were recorded in other parts of Vilnius county when interest rates rose (see Chart A, right-hand panel). Since the number of loans granted in the city of Vilnius and the rest of the county fell by a similar margin (around 30%), it can be concluded that, with the increase in interest rates, households in the city of Vilnius were more likely than those in other parts of the county to take out loans to purchase cheaper and/or smaller housing. The seven smallest counties in Lithuania also stood out, where, unlike in Vilnius county, the real loan value remained almost unchanged in the centres, while in the periphery it increased by more than 7%.
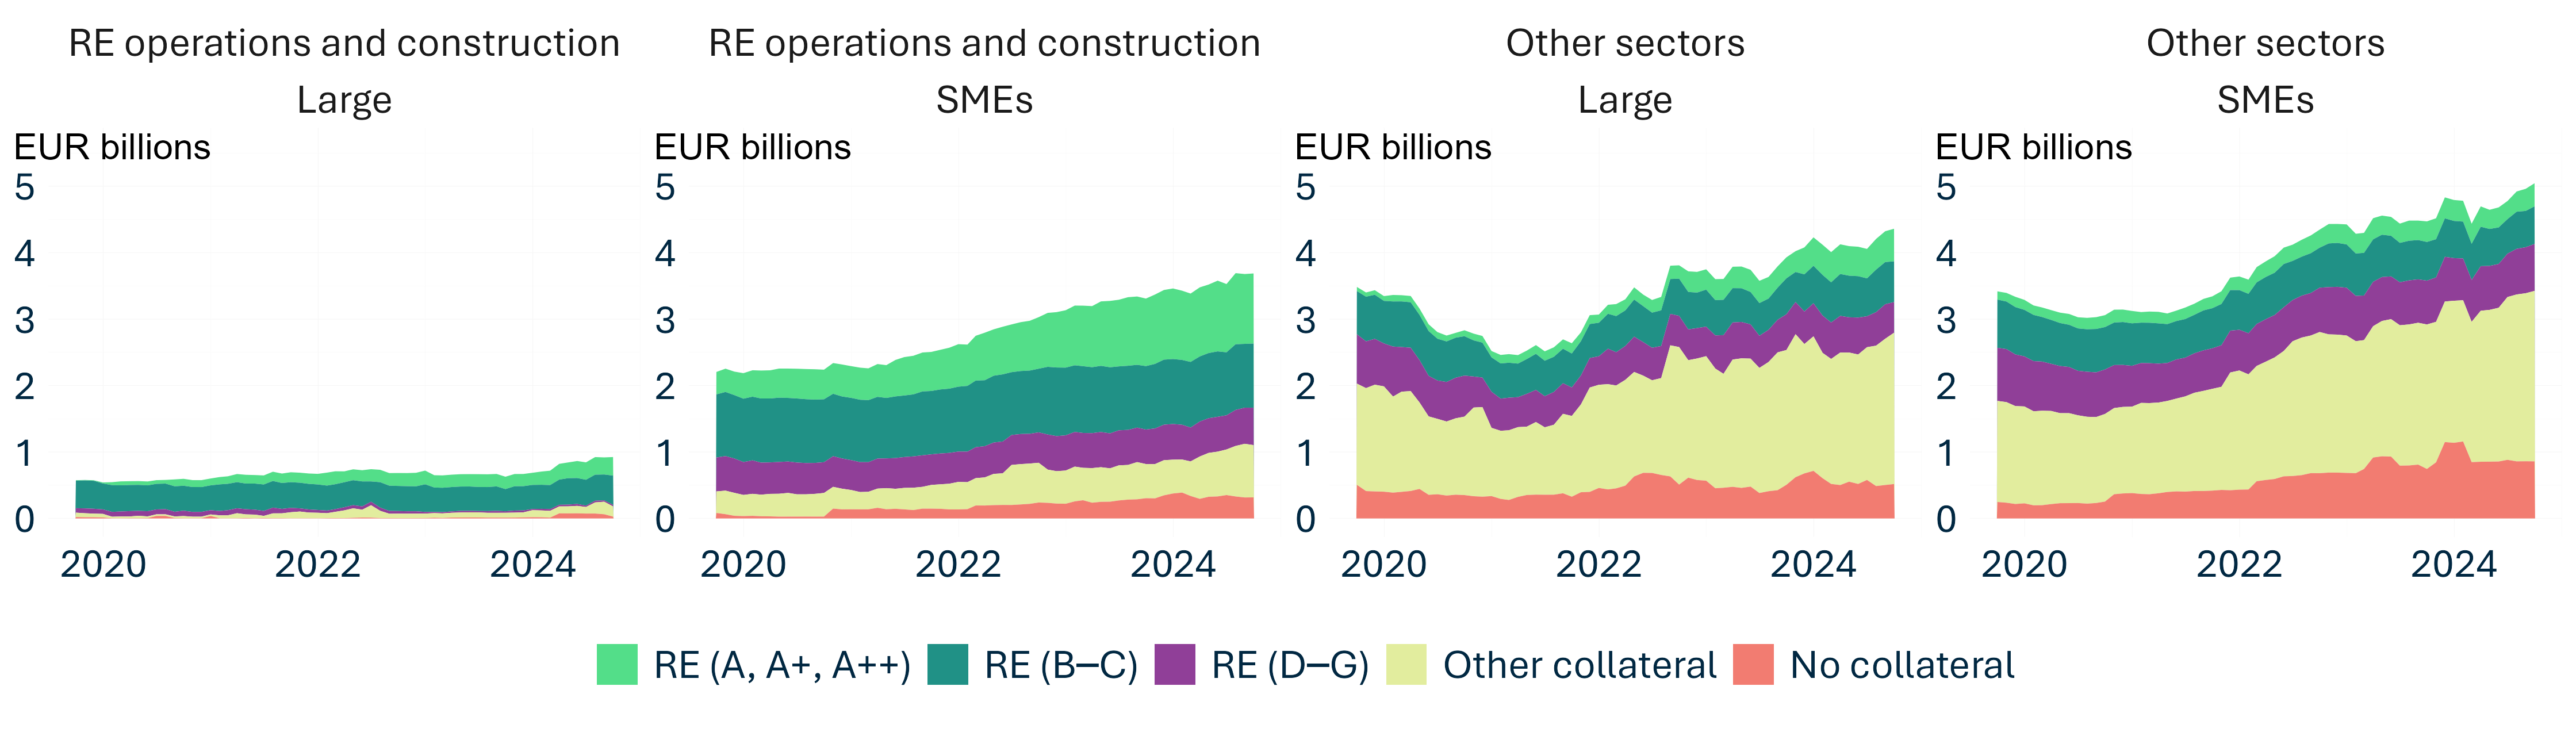
Collateral is often required for loans, and companies in the RE operations and construction sectors most often use RE collateral to finance loans, while companies in other sectors use other types of assets.
Chart A. Portfolio of loans to NFCs by type of collateral, size of company, and economic sector
Sources: New LRDB, State Enterprise Centre of Registers, and Lietuvos bankas’ calculations.
Notes: Other collateral is defined as non-RE collateral according to the classification of the new LRDB, such as gold, cash and deposits, securities, loans, equity instruments and investment fund shares, financial guarantees, other physical securities, and non-RE type protection. Loans with other types of collateral also include loans with less than 20% of the loan value secured by RE collateral or unregistered buildings.
Between September 2019 and September 2024, new loans with significant RE collateral accounted for around one third of the total value of new loans, and their average value was significantly higher than that of loans without RE collateral (see Table A). During this period, there was also a significant correlation between the average value of new loans secured by RE and the quality of collateral. The average value of loans with the highest energy efficiency collateral was €1.2 million, and this decreased in line with the quality of RE collateral: RE collateral of B–C energy efficiency was used for loans averaging €0.5 million, while RE collateral with the lowest energy efficiency was used for loans averaging €0.25 million. The average value of loans with other types of collateral was €86,000, while the value of unsecured loans was the lowest and stood at around €22,000.
Table A. Indicators of new loans to NFCs granted between September 2019 and September 2024 based on the new LRDB
|
Collateral |
Average loan value, EUR millions |
Number of loans, units |
Loan value, EUR millions |
Average loan-collateral ratio, % |
Average interest rate, % |
||||
|
|
|
Only RE collateral |
Total collateral |
SME |
Large |
4 banks* |
Others |
||
|
A, A+, A++ |
1.202 |
1,551 |
1,864 |
66 |
42 |
6 |
4.4 |
4.7 |
6.9 |
|
B–C |
0.535 |
4,361 |
2,332 |
75 |
50 |
5.9 |
5.7 |
4.5 |
6.6 |
|
D–G |
0.253 |
7,225 |
1,828 |
84 |
58 |
6.1 |
5.8 |
4.7 |
6.6 |
|
Other |
0.086 |
118,505 |
10,244 |
– |
83 |
4.7 |
3.7 |
4.1 |
5.1 |
|
No collateral |
0.022 |
110,992 |
2,469 |
– |
– |
6.6 |
4.4 |
7.5 |
5.6 |
|
Total |
0.077 |
242,634 |
18,737 |
79 |
80 |
5.6 |
3.8 |
5 |
5.5 |
Source: New LRDB, State Enterprise Centre of Registers, and Lietuvos bankas’ calculations.
Note: The group of four banks consists of: Swedbank AB (including Swedbank lizingas, UAB); AB SEB bankas; AB Artea bankas, formerly Šiaulių bankas AB (including UAB SB lizingas); and the Lithuanian branch of Luminor Bank AS (including Luminor Lizingas UAB).
Other types of assets were often pledged together with the RE collateral, and the interest rate was probably affected more by other characteristics of the borrower and the creditor than by the quality and type of RE collateral. During the period under review, the average loan-to-value ratio of new loans with the highest energy performance collateral was 66%. However, when taking into account the additional collateral of other types of assets for these loans, the loan-to-total collateral ratio was on average 24 percentage points lower. A similar difference was observed for loans secured by lower-quality RE collateral. This suggests that companies seeking higher levels of funding or other more favourable loan terms are still faced with relatively tight collateral requirements, irrespective of the energy performance of the collateral. In addition, RE collateral is likely to be required to obtain a significantly larger loan. By contrast, the loan interest rate, unlike the loan-to-collateral ratio, was not as strongly related to the quality and type of collateral and depended on other characteristics of the loan and the borrower, with loans to large companies on average having a lower interest rate. This may be partly related to the fact that large companies are more likely to borrow from large lenders. In September 2024, 84% of the loan portfolio of large companies was made up of loans from the four largest lenders.
1.3.Resilience of businesses and households
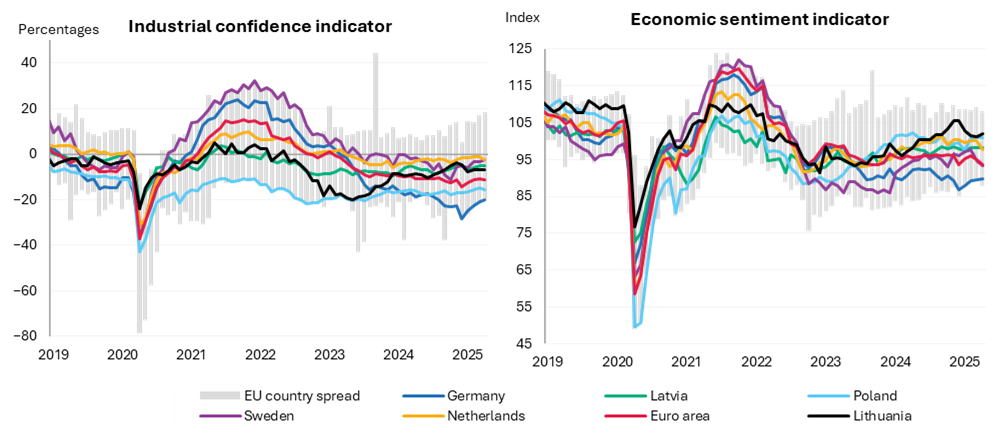
US import tariffs have not yet had a significant impact on the expectations of Lithuania’s main trading partners.
Chart 7. EU industrial confidence and overall economic sentiment indicators
Source: Eurostat.
Note: The economic sentiment indicator is a composite indicator calculated by weighting the economic sectors differently – industry at 40%, services at 30%, consumers at 20%, and construction and retail at 5% each.
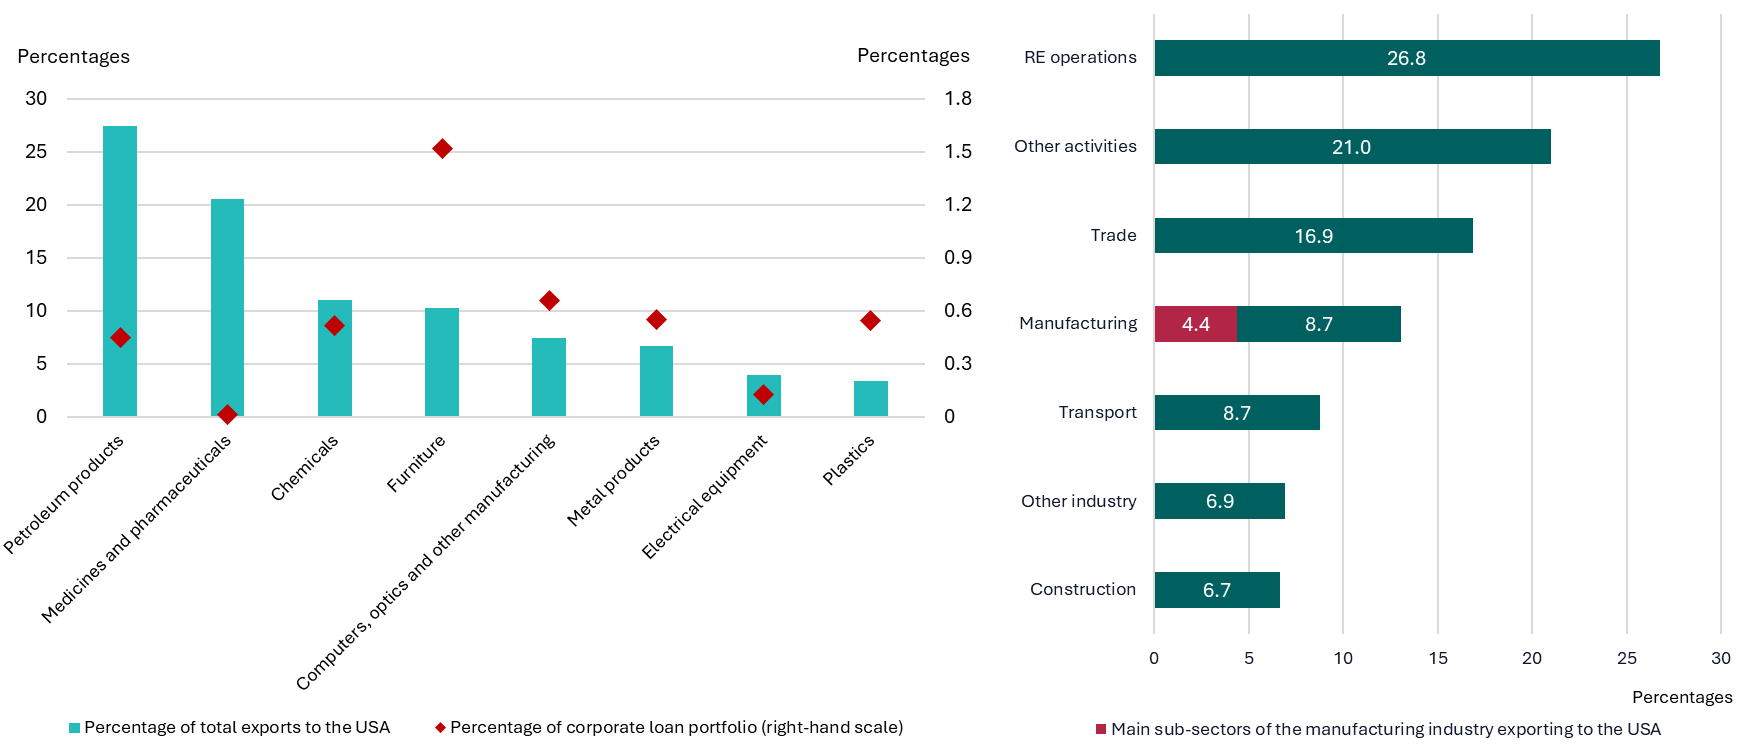
The share of manufacturing sub-sectors directly affected by US import tariffs in the corporate loan portfolio is limited, but the impact could be much more significant through indirect channels.
Chart 8. Shares of the main manufacturing sub-sectors exporting to the USA in total exports to the USA and their shares in the total corporate loan portfolio (left-hand panel), and shares of loans to economic sectors in the total corporate loan portfolio (right-hand panel)
Sources: State Data Agency, LRDB, and Lietuvos bankas.
Note: “Other industry” includes the mining (B), energy (D), and water supply and waste management (E) sectors (according to NACE Rev. 2.1).
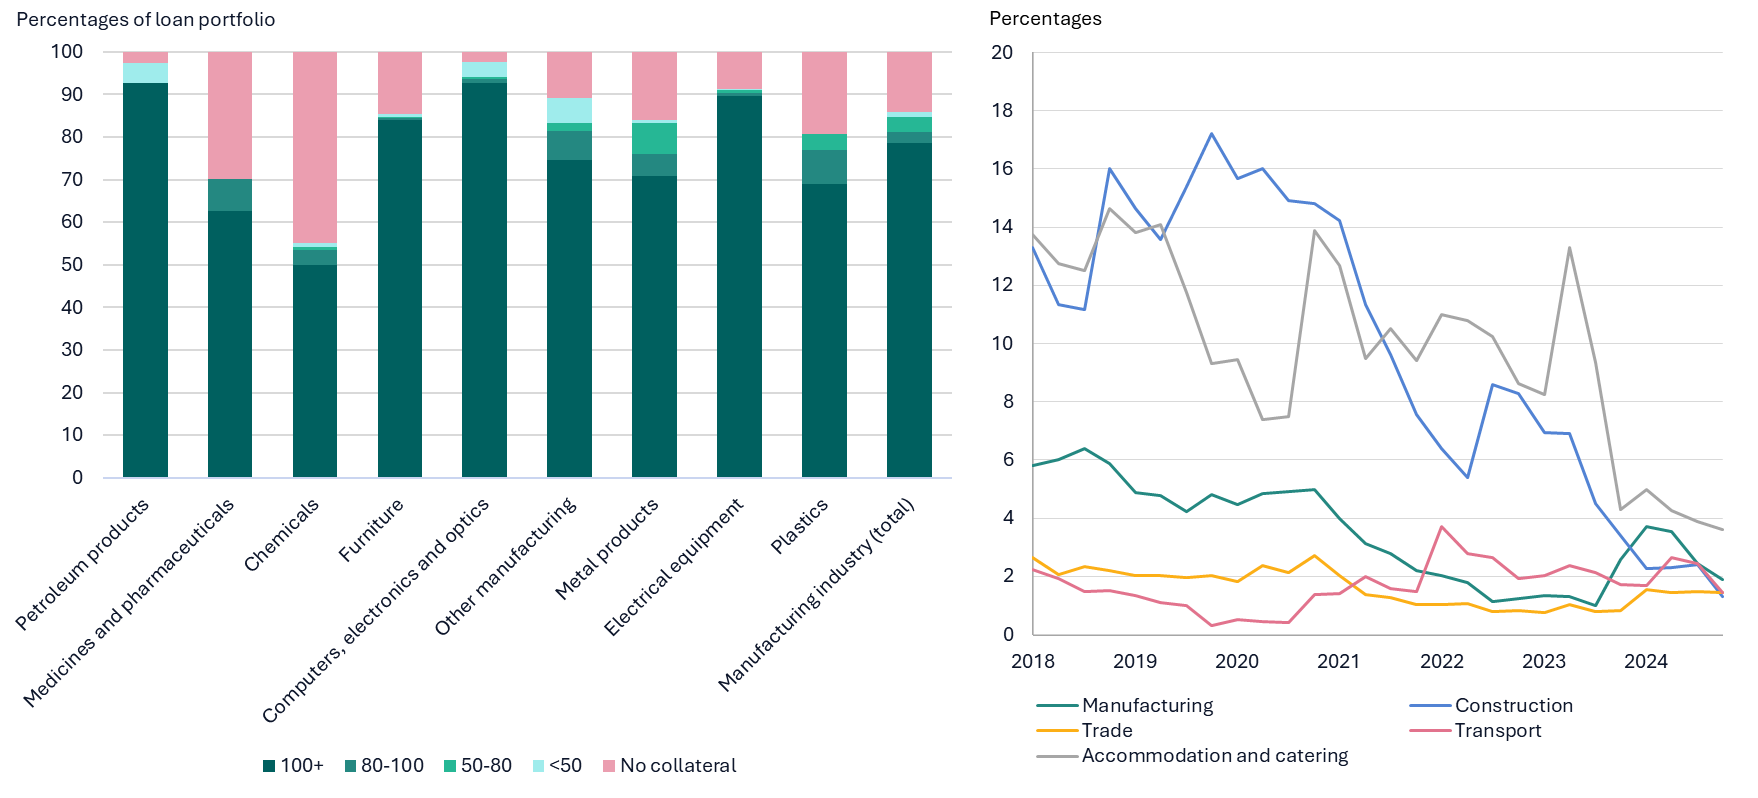
The risk of debt default in sectors vulnerable to a decline in export demand is mitigated by low leverage and high collateral-to-loan ratios. The share of unsecured loans was low at the end of 2024, accounting for around 13% of the total corporate loan portfolio. In the portfolio of directly vulnerable sub-sectors of the manufacturing industry, this share was slightly higher, at 16%, while the share of the whole manufacturing industry stood at 14% (see Chart 9, left-hand panel). The majority of the portfolio of directly vulnerable companies in the manufacturing sub-sectors consists of loans with collateral amounting to 100% or more of the loan value, with such loans accounting for 78%. According to balance sheet statements of NFCs of 2023, the manufacturing and transport sectors were the least leveraged, with liability-to-asset ratios of 39% and 43%, respectively. Meanwhile, their share of debt owed to group or other companies was lower than the overall average for all NFCs. The resilience of the corporate sector was further supported by the fact that total corporate financial assets grew slightly faster than total corporate liabilities in 2024 (by 9.7% and 8.8%, respectively) and corporate net financial assets increased by 15.4% (to €20.4 billion in the fourth quarter of 2024), indicating that companies have sufficient reserves should the situation deteriorate.
Risks are mitigated by the good quality of the loan portfolio and the high degree of collateralisation in vulnerable sectors.
Chart 9. Structure of loan portfolio in directly vulnerable manufacturing sub-sectors by collateral value-to-loan ratio (left-hand panel) and level of non-performing loans of companies in major sectors (right-hand panel)
Sources: LRDB and Lietuvos bankas.
Overall, Lithuanian companies remain resilient amid elevated trade policy uncertainty. Manufacturing sub-sectors directly vulnerable to US import tariffs are characterised by low leverage and good credit quality, so the direct impact of US tariffs on the financial system is limited. Greater risks could arise through indirect channels, affecting export-dependent manufacturing, transport, and trade companies, most of whose exports are directed to Lithuania’s main foreign trading partners, who themselves are more vulnerable to US tariffs. However, in the current environment of uncertainty, indirect channels and their impact on Lithuanian companies are difficult to assess.
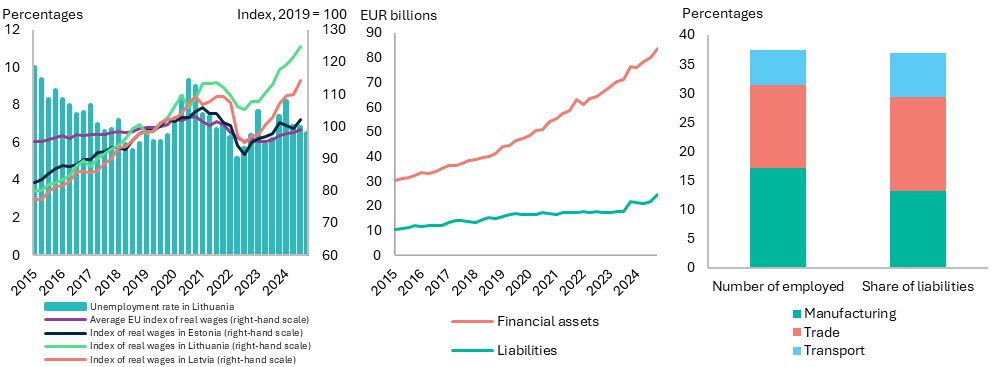
Strong wage growth and a favourable labour market have strengthened the financial resilience of the population, but people working in export-dependent sectors may face higher risks in the future.
Chart 10. Unemployment rate and wage developments (left-hand panel), financial assets and liabilities of households (central panel), and the share of workers in the sectors most sensitive to US import tariffs and their financial liabilities to credit institutions (in terms of the residual loan value) (right-hand panel)
Sources: State Data Agency, Household Financial Monitoring Information System, Eurostat, and Lietuvos bankas’ calculations.
The future financial resilience of the population will depend on changes in the macroeconomic situation of Lithuania and its main export partners, as well as the state of the labour market. The imposition of US import tariffs could affect Lithuanians working in sectors mostly exporting to the USA, in particular at manufacturing companies, and also, as a result of the indirect impact of the tariffs, those working in the trade and transport sectors. These sectors make up a significant share of the labour force in Lithuania and account for around one third of total household liabilities (see Chart 10, right-hand panel). Some workers in the sectors most sensitive to US import tariffs could lose their jobs or suffer wage cuts, which would have a direct impact on their compliance with their commitments (in 2024, more than 4,000 workers in tariff-sensitive sectors had housing loans). A deterioration in the economic outlook could lead to financial difficulties for companies, leading to more lay-offs, a more significant increase in the unemployment rate, and wage cuts.
1.4.Trends in housing and CRE markets
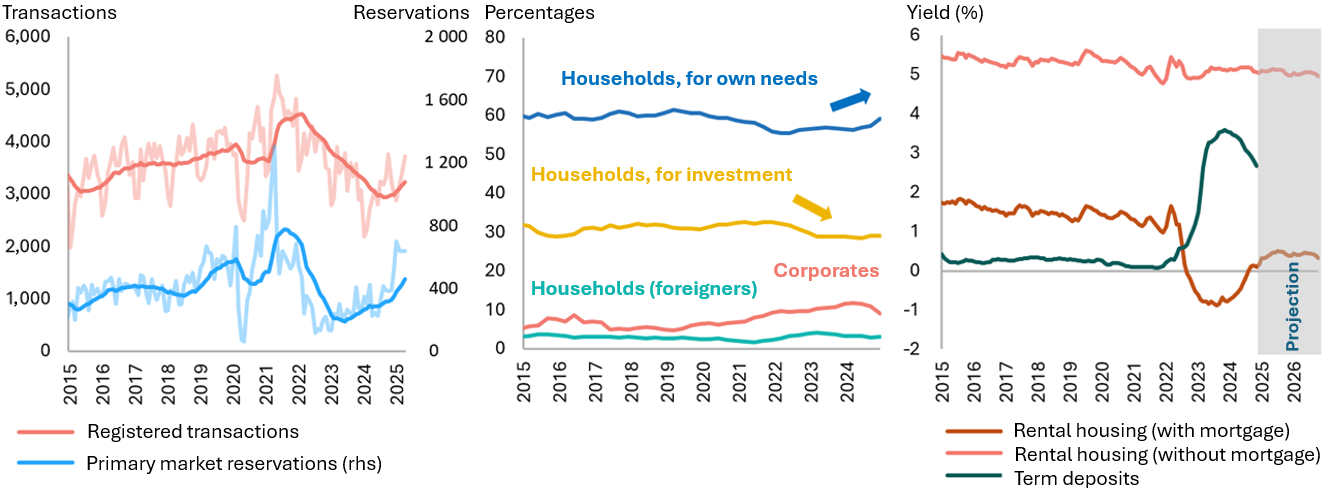
Housing market activity is increasing rapidly, but overall housing demand is growing at a sustainable pace. In 2024, the number of housing units sold was a tenth lower than in 2023, and the lowest since 2012. However, the housing market rebounded from the trough in the summer of 2024, and in the first quarter of 2025 the number of sales on the primary and the secondary markets grew by 50% and a third year on year, respectively (see Chart 11, left-hand panel). Market activity is driven by the falling cost of borrowing, with new housing loan rates having fallen to 4% since their peak of 5.9% in autumn 2023, and the number of issued loans already above the long-term trend. The improving affordability of housing in the closest future supports the expectations of further sales growth. On the other hand, in the face of geopolitical tensions, market is developing sustainably, with no sudden increase in demand as was observed during the pandemic.
The subdued investment activity is contributing to the sustainable growth of demand. First-time buyers returned to the market as the cost of borrowing declined. In the fourth quarter of 2024, the share of such acquisitions was 65% in Lithuania and 59% in Vilnius (see Chart 11, central panel). On the other hand, the interest of investors who were active in the market until the summer of 2022 remains subdued. In both Vilnius and Lithuania as a whole, the share of investment transactions by residents in summer 2022 was 32% and 26%, respectively, while by the fourth quarter of 2024 it had shrunk to 29% and 25%, respectively. There has also been a significant decrease in the number of housing purchases by companies. This trend is probably due to a deterioration in the attractiveness of housing investment: for instance, in Vilnius, rental yields were negative in 2022–2024 (when buying a house with a loan), and only recovered to zero in 2025 (see Chart 11, right-hand panel). Survey data confirm this trend: although housing is still the most attractive investment for the majority of the population, its attractiveness decreased in 2023–2024.
As the housing market activity increases, more housing units are purchased for individual needs, but overall market development is sustainable.
Chart 11. Monthly number of housing purchases in Lithuania (left-hand panel), composition of buyers in Vilnius (central panel), and rental yields in Vilnius (right-hand panel)
Sources: State Enterprise Centre of Registers, UAB Inreal, UAB OBER-HAUS nekilnojamas turtas (Ober-Haus), and Lietuvos bankas’ calculations.
Notes: The darker curves on the left-hand and central panels are 12-month moving averages. Rhs – right-hand scale.
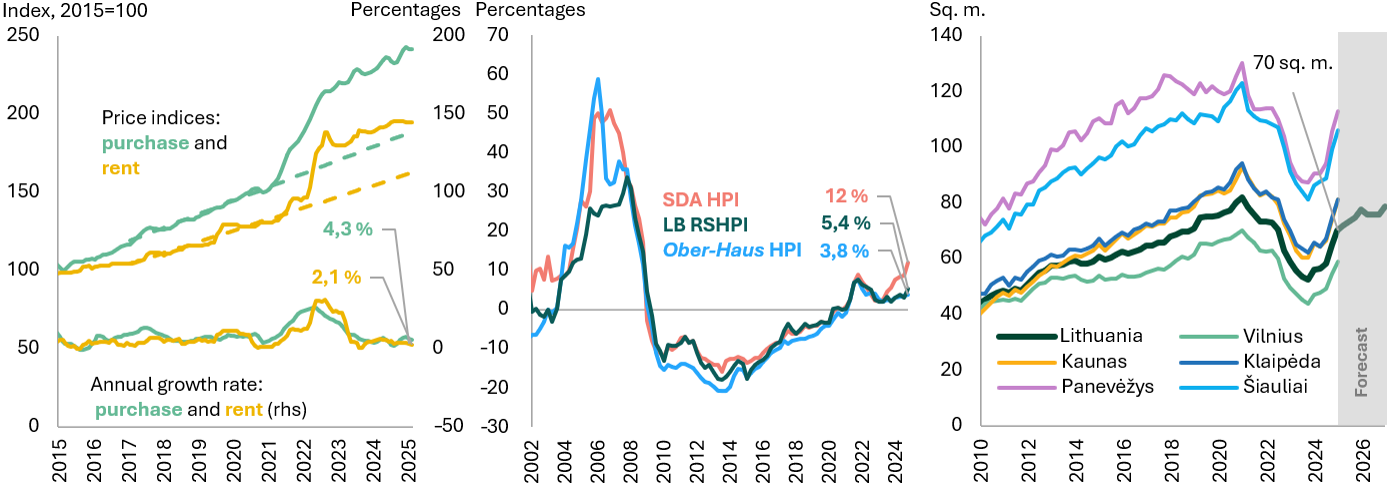
With housing sales prices rising faster than rental prices, price imbalances began to widen slightly in 2025. The pace of house price growth picked up slightly with increasing market activity, but remains moderate, with the LB RSHPI and Ober-Haus house price indices growing 4.3% and 4.9% year on year, respectively, in April 2025 (the averages for 2015–2025 are 7.2% and 8.8%, respectively). Rising expectations of purchasing a home among households put downward pressure on rental prices, as they rose more slowly than sales prices from autumn 2024 onwards (see Chart 12, left-hand panel). Overall, the growth of both housing sales and rental prices has stabilised and is moderate. However, in the absence of a price correction, housing sales prices are still at their historical highs, as reflected in the LB RSHPI-based estimates, which suggest that house prices may be overvalued by around 5% (see Chart 12, central panel).
House prices are rising moderately and affordability is improving, but price imbalances persist.
Chart 12. Sales and rental prices of housing in Lithuania (left-hand panel), overvaluation of house prices according to different indices (central panel), and the average space of housing affordable when buying with a loan (right-hand panel)
Sources: Lietuvos bankas, Ober-Haus, State Data Agency, and Lietuvos bankas’ calculations.
Notes: The left-hand panel shows the purchase price data from LB RSHPI and rental price data from Ober-Haus; in the central panel, the overvaluation is calculated as the median of six different indicators, see here for more details; in the right-hand panel, the average wage is used for calculations, with the RLRs in force from 2015 for all periods; HPI stands for the house price index.
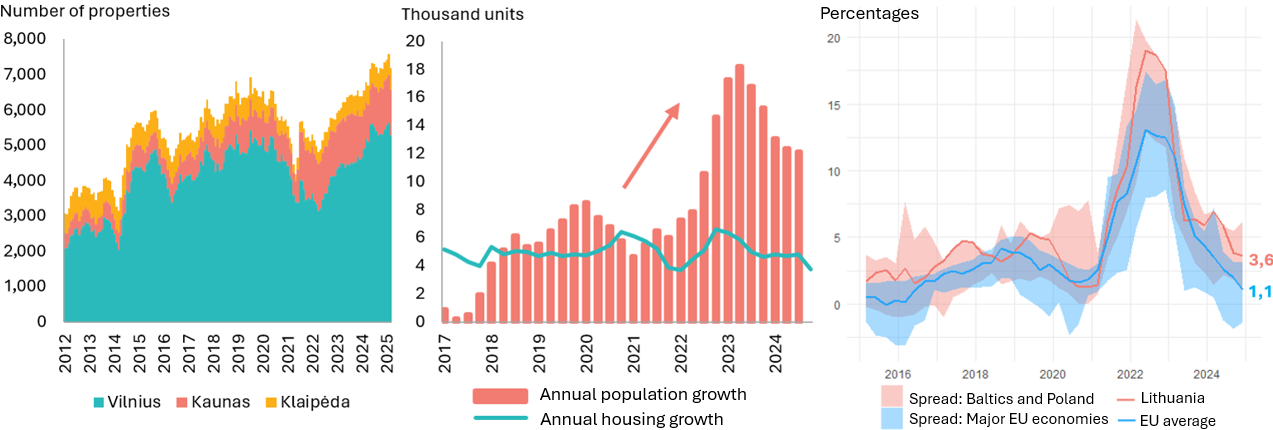
Accumulated home supply has so far limited larger price hikes, but intensifying urbanisation may lead to shortages in the future and increase upward pressure on prices.
Chart 13. Housing supply on the primary market of major Lithuanian cities (left-hand panel), housing supply and population growth in Vilnius (central panel), and annual growth of housing construction prices (right-hand panel)
Sources: UAB Inreal, State Data Agency, Vilnius Territorial Health Insurance Fund, and Eurostat.
Notes: The right-hand panel includes Germany, France, Italy, and Spain in the category of major EU countries.
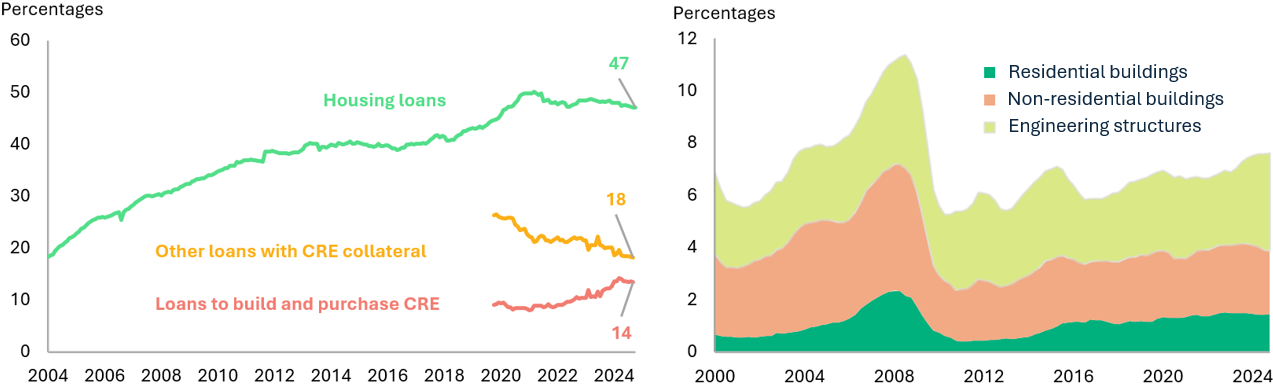
The sustainable development of the RE market is important for the stability of the financial system and economic growth.
Chart 14. Share of RE loans in bank credit portfolio (left-hand panel), and share of RE activities in GDP (right-hand panel)
Sources: Lietuvos bankas and State Data Agency.
Notes: The left-hand panel shows the share of loans by type in the total bank portfolio of loans to the private non-financial sector.
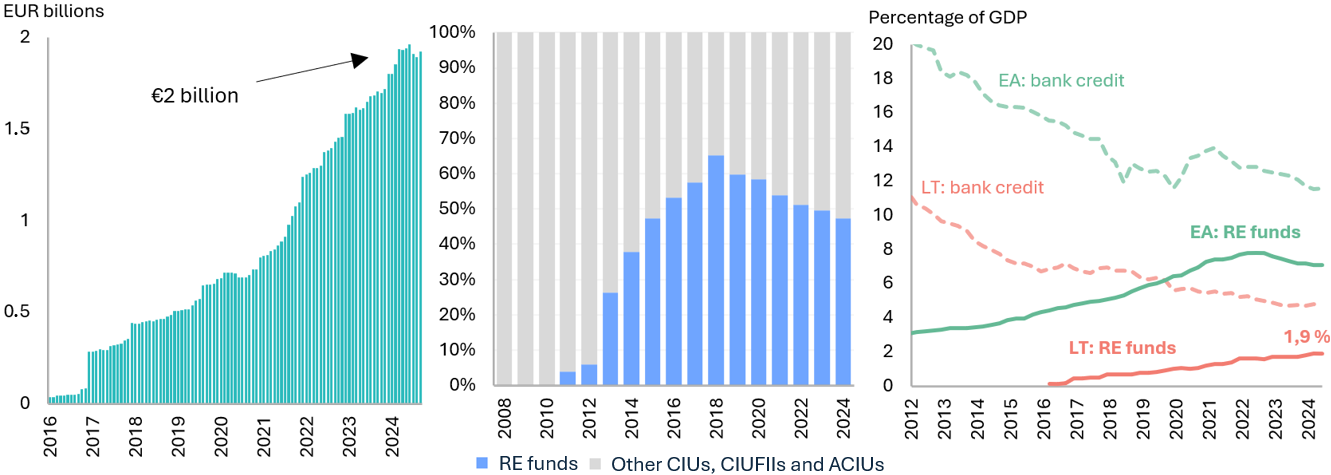
RE funds are becoming an important source of financing for RE activities and an alternative to bank credit.
Chart A. Value of assets managed by RE funds registered in Lithuania (left-hand panel), structure of the Lithuanian CIU sector (central panel), and sources of funding of RE activities in Lithuania and the euro area (right-hand panel)
Sources: Lietuvos bankas, ECB Statistical Data Warehouse, and Eurostat.
Notes: CIUFIIs – CIUs for informed investors; ACIUs – alternative CIUs; right-hand panel shows credit to RE operations and construction companies allocated to RE activities; EA – euro area; LT – Lithuania.
Funds in Lithuania manage RE mainly by financing special purpose vehicles (SPVs) as this helps manage financial risk and use the beneficial tax environment. Two thirds of the investments of RE funds are managed indirectly by providing funding to SPVs. RE funds invest in SPVs by taking an equity stake as well as by providing loans to them and buying SPV bonds. Indirect RE management is attractive to funds because it allows them to limit the financial risks of a project at the level of the individual company. In addition, when capital is invested in SPVs in the form of a loan, interest can often be deducted from taxable income. Around one third of the premises and land of RE funds is also managed directly. Direct asset management is encouraged by the availability of the full benefit of Article 12(5) of the Republic of Lithuania Law on Corporate Income Tax, which exempts property rental or sales income from taxation.
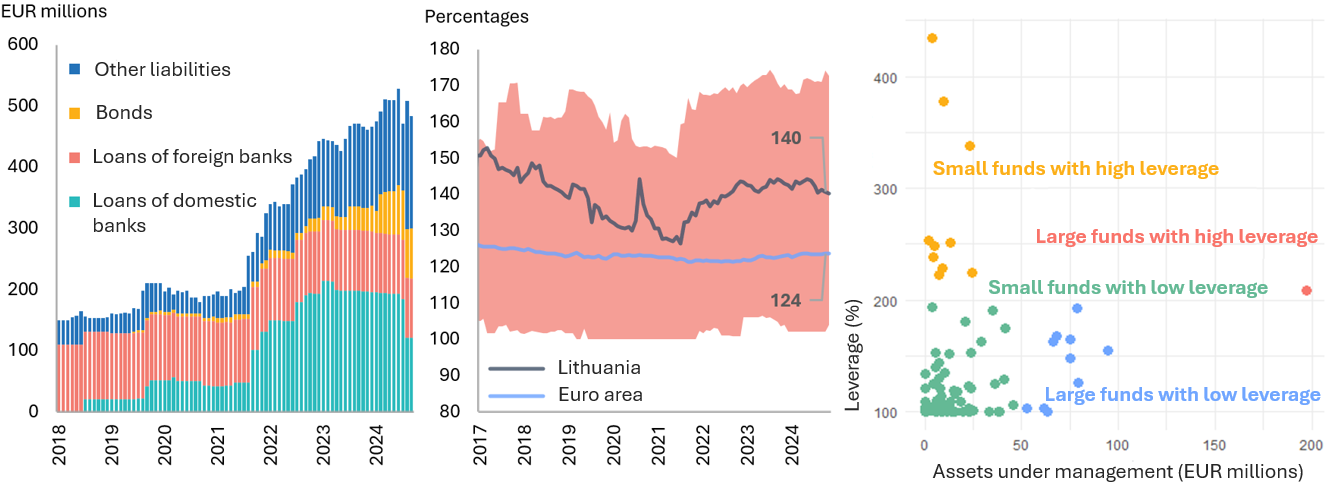
RE funds are mainly financed by shareholders’ capital. The share of equity in the overall funding structure of funds has historically varied between 60% and 75%, with other funding needs being met by loans (mainly from banks, see Chart B, left-hand panel). In terms of leverage (the ratio of assets under management to the value of net assets), Lithuanian RE funds rank alongside more highly leveraged euro area countries: in the third quarter of 2024, the average leverage ratio in the euro area was 124%, while in Lithuania it was 140% (see Chart B, central panel). On the other hand, the risks arising from higher leverage in Lithuania are concentrated in a few funds: one large higher-leveraged fund and several small higher-leveraged funds, which together manage 15% of the sector’s total assets (see Chart B, right-hand panel). With some RE funds approaching their closing dates, the last two years were important for refinancing or repaying liabilities to banks. The latest data indicate that, despite tensions on the RE market, the funds have successfully refinanced their largest liabilities.
The low prevalence of open-ended RE funds significantly reduces the level of risk to the financial system in Lithuania. With falling RE investment returns and deteriorating fund performance, investment funds may face pressure from investors to redeem their shares, which may trigger asset sell-off. Given the relatively low liquidity of RE as an asset class and a lack of liquid assets in funds, a rush to sell RE could cause prices to fall sharply. However, unlike the major euro area economies, Lithuania is dominated by closed-end RE funds, i.e. fixed-term funds where investments are “locked in” for 6–10 years, and shareholders have very limited options to redeem the investment prematurely. This means that, as the real return on RE as an asset class declines, forced sales of assets are less likely in Lithuania, and the risk of liquidity mismatches is less relevant.
Lithuanian RE funds are on average more leveraged than the euro area average, but in general most funds are small and have low leverage.
Chart B. Leverage structure of Lithuanian RE funds (left-hand panel), average leverage and its spread across euro area countries (central panel), RE funds in Lithuania by assets under management and leverage (right-hand panel)
Sources: Lietuvos bankas and ECB Statistical Data Warehouse.
Note: Right-hand panel shows data for September 2024. Small RE funds are those with assets under management of up to €50 million, while low-leverage funds are those with a ratio of assets under management to net asset value of 200% or less.
As in the euro area generally, assets managed by Lithuanian RE funds and their investors are mainly local. In the third quarter of 2024, €1.4 billion (or 75%) of RE investments managed by Lithuanian funds were located in Lithuania, and this share has remained broadly unchanged over the past five years. A significant portion of managed assets was also concentrated in the other Baltic countries, with Latvia and Estonia accounting for 13% and 3% of total assets, respectively, and Poland accounting for 5%. In terms of geography, asset distribution trends in Lithuania do not differ significantly from those in the euro area countries, with most assets being managed in the same country in which the RE fund is established. Lithuanian RE funds are mainly financed by Lithuanian capital, and the relative importance of foreign capital has been declining: in the third quarter of 2024, Lithuanian capital accounted for 83% of the investor base of Lithuanian RE funds (up from around 50% in 2018). The importance of foreign investment in Lithuania is slightly lower than in the euro area as a whole, where it accounts for around one third of investment on average.
RE funds are becoming a significant and relatively safe alternative for financing RE activities. The RE fund market has grown rapidly since 2017, with the value of assets under management in the sector reaching €2 billion at the end of 2024. Compared to the euro area as a whole, Lithuanian RE funds are more leveraged, but the overall level of risks associated with the sector’s development is low due to the prevalence of closed-end funds and limited links with banks and foreign markets. The sector remained resilient in 2023–2024 when, despite tensions on the RE market, funds successfully refinanced or repaid their largest loans. This indicates that there is currently no need to apply macroprudential policy measures to RE funds.
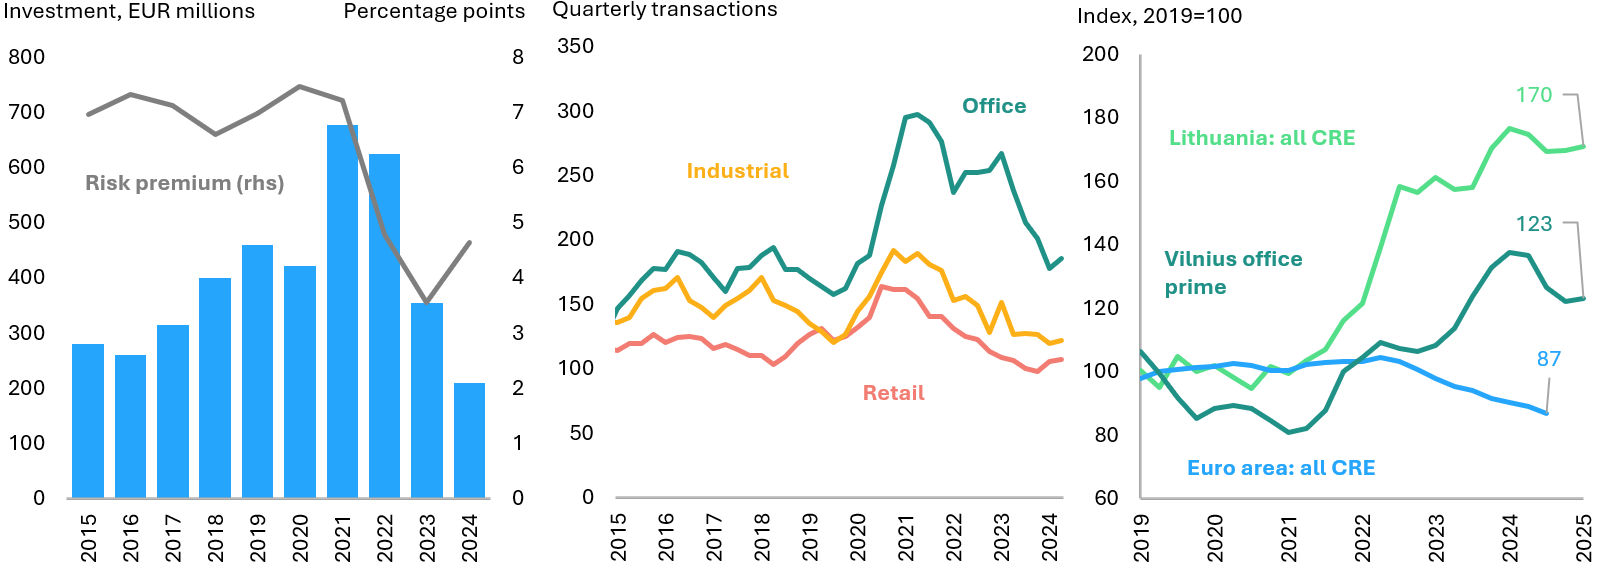
Activity on the CRE market remains subdued and is still constrained by a reduced investment risk premium and geopolitical tensions. With the decline in yields of government bonds, the risk premium on CRE investments increased slightly in 2024 but remained around 2 percentage points lower than in the period before the tightening of the monetary policy (see Chart 15, left-hand panel). As investors sought more attractive alternatives, the volume of CRE investment transactions fell to its lowest level in a decade: in 2024, transactions worth €210 million were concluded, i.e. a value three times less than that of the record years of 2021 and 2022. On the other hand, there are signs that the trough has already been reached as the volume of transactions in the first quarter of 2025 alone reached €150 million. In addition, the latest figures on the number of transactions (see Chart 15, central panel) also indicate a gradual increase in market activity (especially in the retail segment).
Activity in the CRE market remains subdued but there has been no broad negative impact on prices.
Chart 15. CRE risk premium and investment volume (left-hand panel), number of CRE purchase transactions in major Lithuanian cities (central panel), and purchase prices (right-hand panel)
Sources: Refinitiv, Colliers, State Enterprise Centre of Registers, and ECB.
Notes: In the left-hand panel, the risk premium is considered to be the difference between the average CRE rent and the yield of 10-year government securities; in the central panel, the industrial premises segment is defined as CRE for manufacturing and logistics purposes.
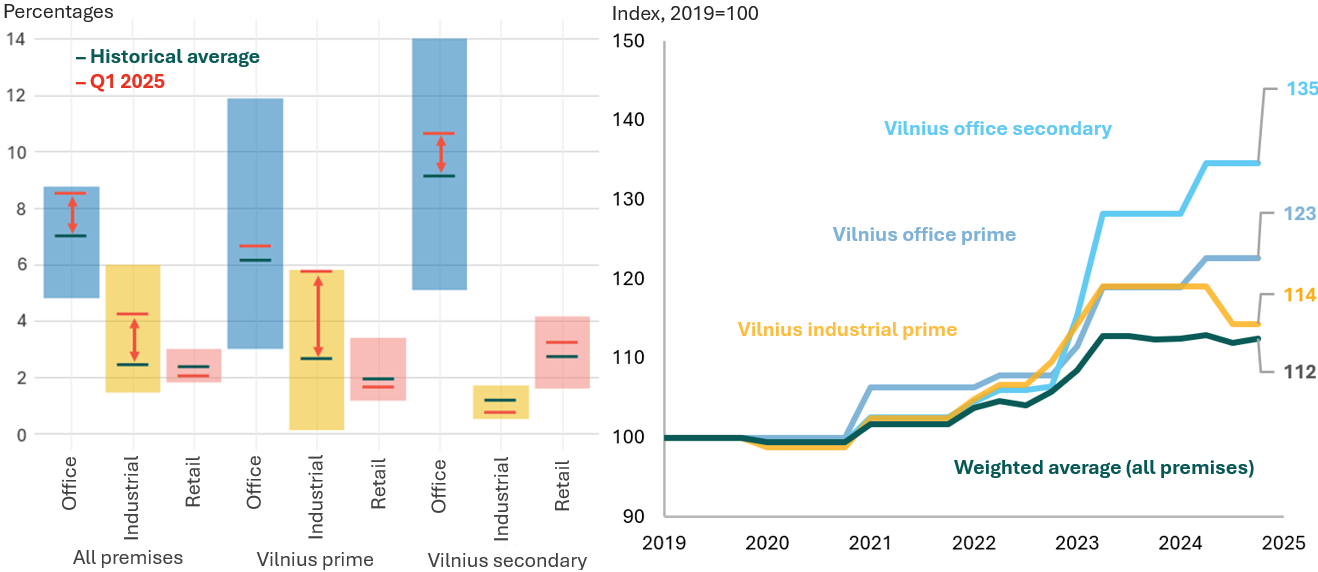
The growing vacancy rate of office and industrial premises is cutting into the income of RE managers and increasing downward pressure on the prices of these premises. Despite tensions on the RE market, the development of commercial premises has continued in recent years as the stock of office and industrial premises in Lithuania’s major cities increased by 30% and 52%, respectively, in 2020–2024 (the development of retail premises was slower, with a recorded increase of 13%). Hybrid work is reducing the demand for offices, but around 150,000 sq. m of leasable space is expected to be added to the market in 2025 alone (10% of the total current stock). With difficulties in absorbing the new supply, vacancy rates are rising: for instance, they rose to 11% in the first quarter of 2025 in secondary class offices in Vilnius (up from 9% a year earlier, see Chart 16, left-hand panel). Vacancy rates also increased in the industrial premises segment, but remain relatively low. On the other hand, rental prices remain stable in Lithuania, unlike in the euro area as a whole where they have adjusted slightly, indicating that the supply and demand imbalance is not profound (see Chart 16, right-hand panel).
With office supply exceeding demand, the vacancy rates of these premises are rising, but stable rental prices indicate that property managers are not facing any serious difficulties.
Chart 16. CRE vacancy rate (left-hand panel), and CRE rental prices (right-hand panel)
Source: Colliers.
Note: In the left-hand panel, the columns show the spread of historical values since 2011. “All classes” means the weighted average vacancy rate of all classes of space in Lithuanian major cities.
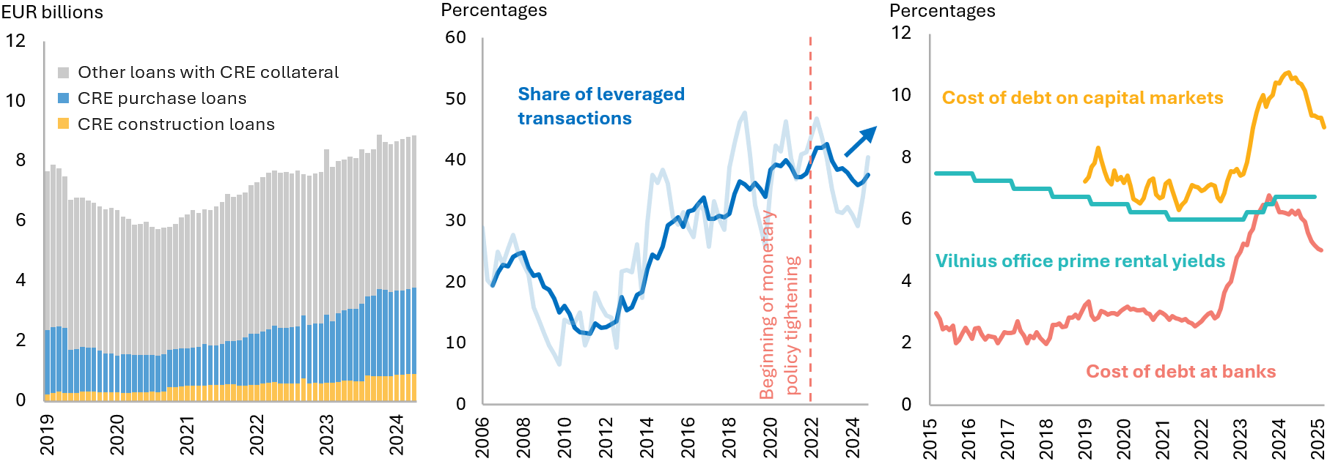
As the expectations of banks regarding CRE price developments have improved, lending for CRE construction and purchase has accelerated. With survey data indicating that no banks expect a CRE price correction, the values of credit portfolios for CRE construction and purchase reached €0.9 billion and €2.9 billion, respectively, in the fourth quarter of 2024 (with year-on-year growth rates of as much as 34% and 21%, respectively, due to the larger individual loans granted, see Chart 17, left-hand panel). The quality of the CRE credit portfolio remained historically good (non-performing loans accounted for 0.4% of the portfolio) and the number of loans for which original provisions had been increased also declined. With credit conditions improving, the share of CRE transactions involving loans has almost returned to the level seen before the tightening of the monetary policy (see Chart 17, central panel). In addition, cheaper borrowing facilitates debt refinancing and improves the profitability of RE managers. For instance, the rental yield for prime office space in Vilnius is already almost 2 percentage points higher than the cost of borrowing from banks (see Chart 17, right-hand panel).
Risks in the housing market have subsided but remain elevated in the CRE segment due to the supply-demand imbalance in the office segment and ongoing refinancing risks. With borrowing costs falling and affordability improving, activity in the housing market continues to pick up. As the risk of house price correction fades, the risk of supply shortages becomes more relevant in the medium term, which may lead to an increase in house price overvaluation in the long run. Falling borrowing costs reduce the level of risk in the CRE segment, while lower price imbalances lead to more positive expectations among market participants regarding future market developments. On the other hand, the level of risk remains elevated as the profitability of RE managers continues to be negatively affected by higher debt servicing costs, while growing office vacancies are putting downward pressure on property prices. However, with banks lending only to the safest CRE projects, the quality of the CRE portfolio is good, and, compared to housing loans, CRE credits account for a smaller share of the total loan portfolio. Therefore, even under an adverse scenario, the losses of banks should not significantly destabilise the financial system.
With borrowing costs going down, the risk of CRE loan refinancing has eased somewhat.
Chart 17. CRE-secured bank loan portfolio (left-hand panel), share of loan-based CRE purchase transactions (central panel), CRE yields and cost of debt (right-hand panel)
Sources: Lietuvos bankas, State Enterprise Centre of Registers, Colliers, and Nasdaq Baltic.
Note: The darker curve in the central panel shows the 1-year moving average, calculated using the value of transactions.
1.5.Banking sector developments and resilience
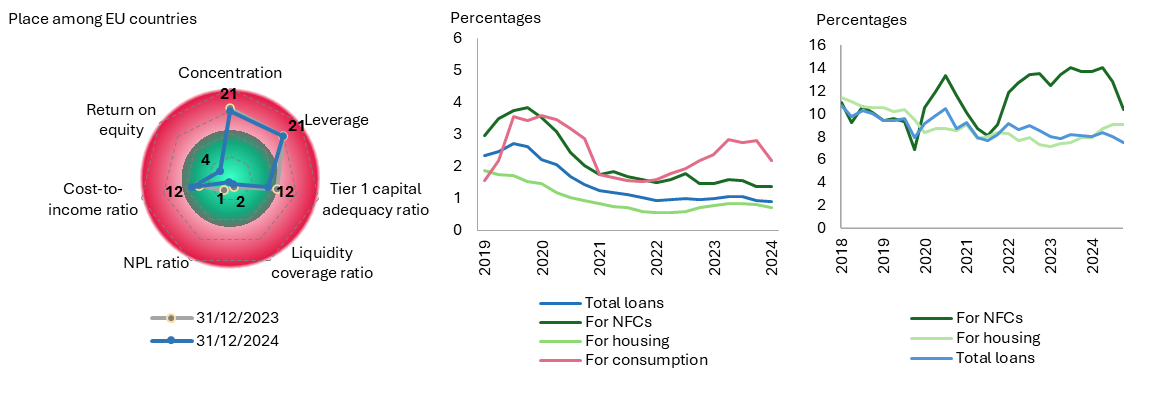
Performance indicators of banks operating in Lithuania remained good in the fourth quarter of 2024, with average liquidity, asset quality and profitability indicators among the best in the EU (see Chart 18, left-hand panel), while the high level of profitability in the banking sector was supported by the still high net interest income of banks. In 2024, the annual growth of net interest income in the banking sector (13%) was supported by the strong growth of the loan portfolio in an environment of declining ECB key interest rates, with the total portfolio of bank loans to the private sector increasing by 11% (13% to NFCs and 10% to households). Although the annual growth of deposits was also strong (14%) over the year, time deposits, which drive the growth of the interest expense of banks, account for only around 27% of all private sector deposits (and this share has remained unchanged since the second quarter of 2024). Their growth slowed in 2024, resulting in a slower increase in the interest expenses of banks. In addition to the significant impact of net interest income, bank income was positively affected by higher net fee and commission income, which increased by 52% in 2024. However, as in the previous year, the activities of Revolut Bank UAB had a significant impact on this (if the impact of Revolut Bank UAB were to be excluded, net commission income would have grown by 9%).
Lithuania’s banking sector performs among the best in the EU, while the level of non-performing or impaired loans remains low.
Chart 18. Comparison of bank performance indicators with EU countries (left-hand panel), share of non-performing loans in the banking sector (central panel), and share of loans with significantly increased credit risk (right-hand panel)
Sources: European Banking Authority (EBA), Lietuvos bankas, and Lietuvos bankas’ calculations.
Notes: Concentration is measured by the Herfindahl-Hirschman Index (HHI). Green shows Lithuania’s indicator, which is better than in most of the EU Member States, whereas red shows a worse indicator. The Lithuanian banking sector is compared with the EBA sample of other countries. The cost-to-income ratio in the left-hand panel was calculated excluding Revolut Bank UAB due to the specific nature of the bank’s business model, as part of the costs incurred internationally by the Revolut Group are attributed to Revolut Bank UAB operating in Lithuania.
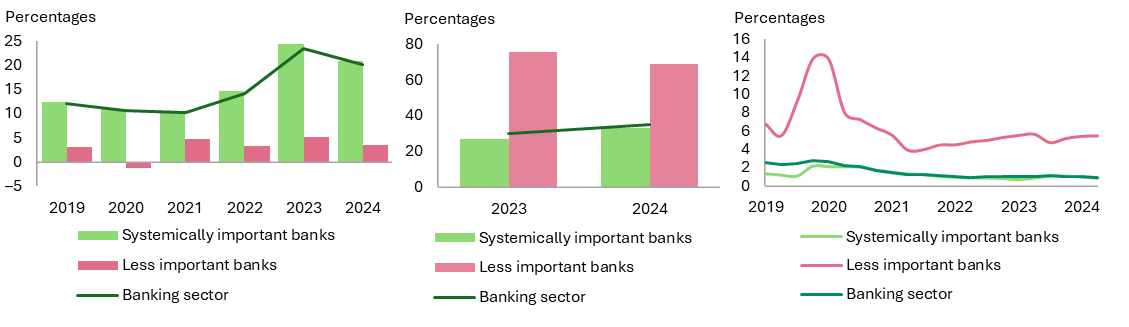
Less diversified services, a base of higher-risk clients, and higher costs lead to significantly lower profitability, efficiency, and asset quality indicators for less important banks.
Chart 19. Indicators of return on equity (left-hand panel), cost-to-income ratio (central panel), and share of non-performing loans by systemic importance of banks (right-hand panel)
Source: Lietuvos bankas’ calculations.
Note: The cost-to-income ratio in the central panel was calculated excluding the solidarity contribution.
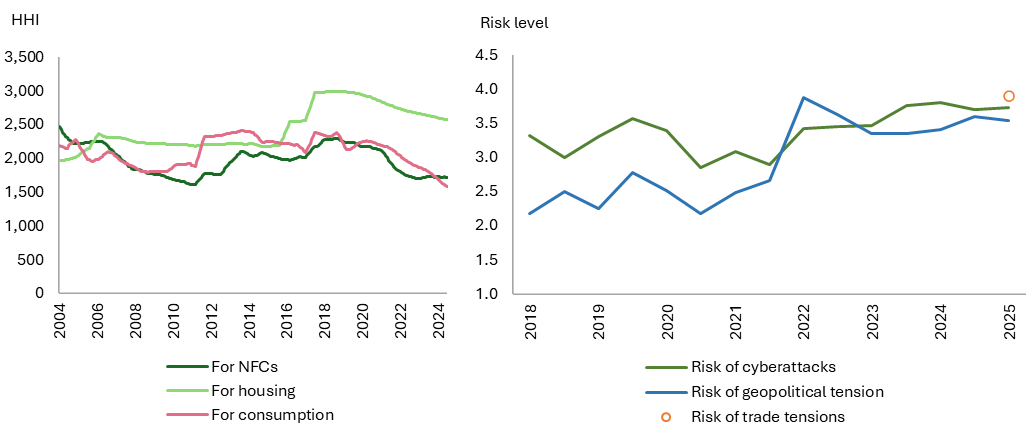
The level of concentration in the bank loan market (especially for housing loans) in Lithuania remains one of the highest in the EU, although it has been declining due to stronger competition (see Chart 20, left-hand panel). The intensified competition on the housing loan market was linked to a significant decline in housing loan margins until autumn 2024, but these margins have now stabilised (in March 2025, the median margin on new housing loans was 1.5%, down by 0.9 percentage points compared to mid-2020). With a new market entrant in the housing loan segment in the second half of this year and competition intensifying further, the concentration of the housing loan market is likely to decline more rapidly. Since 2018 – with the addition of 11 newcomers to the banking sector mainly specialising in consumer loans and loans for SMEs, and the increased presence of existing medium-sized market players – the concentration in these loan portfolios has continued to decrease.
Banks estimate that the most significant risks to the sector and the financial system as a whole in the first quarter of 2025 were trade tensions, cyberattacks, and geopolitical risks (see Chart 20, right-hand panel). Trade tensions were considered to pose the greatest risk to the banking sector as they could adversely affect the quality and profitability of banking sector loans, but large capital and liquidity buffers, high profitability, as well as the low share of loans to companies exporting to the USA reported by banks in their loan portfolio mitigate the potential adverse effects of this risk.
According to the Bank Lending Survey conducted by Lietuvos bankas, the share of banks that encountered cyberattacks increased in the first quarter of 2025, and banks themselves consider this risk as one of the most important (see Chart 20, right-hand panel). From September to December 2024, there was a particularly sharp increase in distributed denial-of-service (DDoS) attacks, which temporarily disrupted the availability of banking services at several financial institutions. In the first quarter of 2025, the number of such incidents continued to increase significantly: although most attacks were not particularly sophisticated, they became more frequent and caused more damage. These types of attacks are highly dynamic and constantly evolving in an effort to circumvent common security tools.
The risk of cyberattacks continues to be one of the most important risks for the banking sector, and the management of this risk is therefore a major focus.
Chart 20. Concentration of the loan market (left-hand panel), and importance of the risks to the financial system assessed by the main banks (right-hand panel)
Sources: Lietuvos bankas’ calculations, results of the Bank Lending Survey conducted by Lietuvos bankas in March 2025.
Notes: In the left-hand panel, concentration is measured by the Herfindahl-Hirschman Index (HHI). In the right-hand panel, risks were classified according to the assessment of significance. Assessment of the level of significance of risks: 1 – low; 2 – lower than medium; 3 – medium; 4 – higher than medium; 5 – high.
1.5.1.Bank solvency situation and resilience
The solvency ratios of banks operating in Lithuania, supported by strong profitability, continue to show the good resilience of banks to possible future surprises. The overall capital adequacy ratio increased from 20% to 21.4% in 2024. Top-tier capital instruments continued to dominate in the banks operating in Lithuania, with the common equity tier 1 (CET1) ratio standing at 19.7%. Capital buffers were also boosted by high bank profitability. In 2024, the return on equity, while declining by 3.4 percentage points over the year, remained among the highest in the euro area (20.2%).
The Lithuanian economy would maintain moderate growth under the baseline scenario and would undergo a two-year recession under the adverse scenario. The baseline scenario is based on the official macroeconomic development projections of Lietuvos bankas of March 2025. Under this scenario, the Lithuanian economy would grow on the back of increasing household consumption, private investment, and recovering foreign demand. The hypothetical adverse scenario assumes that Lithuanian exports would contract sharply due to international conflicts and trade tensions. Declining foreign demand would slow down manufacturing and other export-oriented sectors, increase the unemployment level, and reduce domestic demand. Finally, the negative macroeconomic environment and imbalances on the RE market would lead to a correction of RE prices.
Table 2. Evolution of the key macroeconomic indicators under stress test scenarios
(percentages)
|
Indicator |
Actual indicator |
Baseline scenario |
Adverse scenario |
||||
|
2024 |
2025 |
2026 |
2027 |
2025 |
2026 |
2027 |
|
|
GDP |
2.7 |
2.9 |
3.0 |
3.0 |
-2.5 |
-2.6 |
1.6 |
|
Exports
of goods and services |
0.3 |
1.6 |
3.6 |
3.6 |
-14.1 |
-14.3 |
-7.6 |
|
Private
consumption expenditure |
3.7 |
4.1 |
3.8 |
3.8 |
-4.0 |
-8.2 |
-2.1 |
|
Unemployment
rate |
7.1 |
6.8 |
6.8 |
6.6 |
7.7 |
10.1 |
11.4 |
|
Compensation
per employee |
10.7 |
9.4 |
7.9 |
7.4 |
3.7 |
0.6 |
4.2 |
|
Average
annual inflation |
0.9 |
3.3 |
2.6 |
2.6 |
1.5 |
2.4 |
1.6 |
|
RE
price index |
9.8 |
8.4 |
8.4 |
10.9 |
-8.2 |
-7.7 |
-5.5 |
Sources: State Data Agency and Lietuvos bankas’ calculations.
Note: Data on GDP, exports of goods and services, and private consumption expenditure are at constant prices.
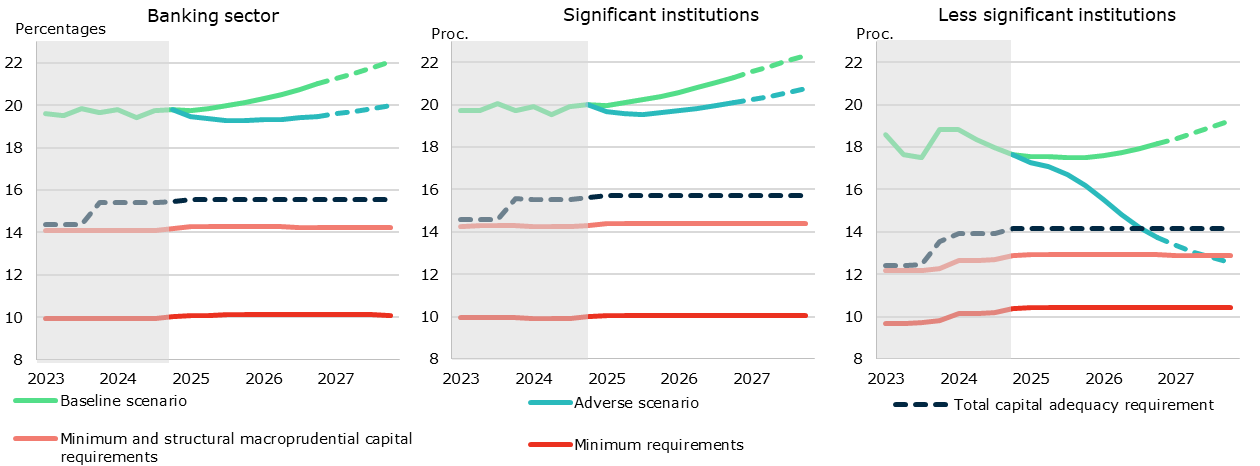
The system of banks and central credit union groups is well-capitalised and remains resilient to potential shocks, but the responses of significant and less significant institutions to a stress test scenario differ.
Chart 21. Changes in total CAR of financial market participants by scenario (left-hand panel), changes in CAR of significant institutions by scenario (central panel), and changes in CAR of less significant institutions by scenario (right-hand panel)
Sources: Bank data and Lietuvos bankas’ calculations.
Note: The minimum requirements consist of an 8% minimum capital requirement and a Pillar 2 capital requirement. The structural macroprudential capital requirements consist of the capital conservation buffer and the other systemically important institutions buffer. The total capital adequacy requirement consists of minimum requirements, structural macroprudential capital requirements, CCyB, and sectoral SRB requirements.
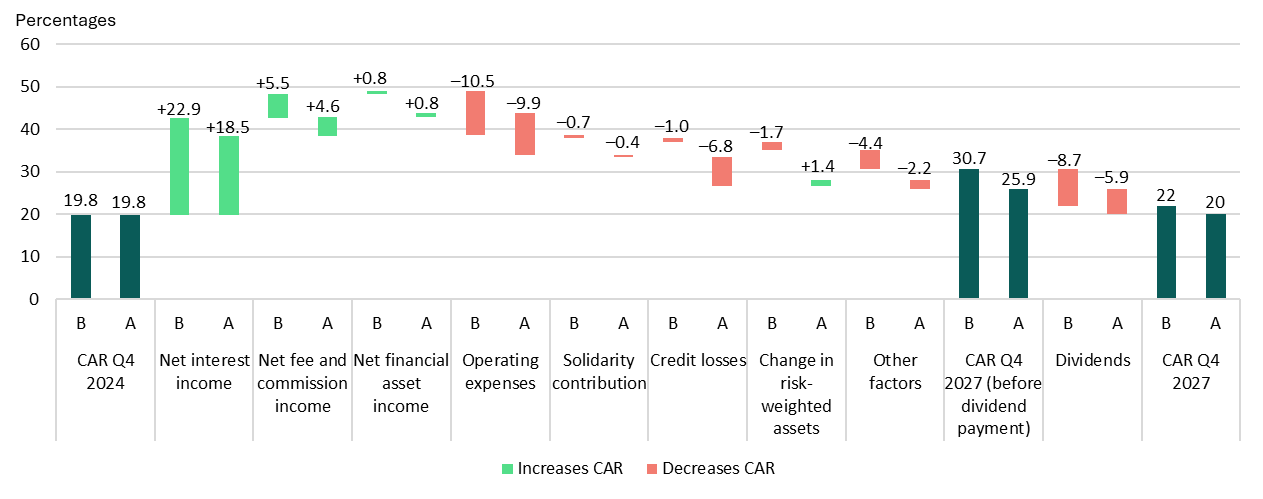
The breakdown of the change in CAR (see Chart 22) indicates that interest income would allow the banking sector to absorb the increase in credit losses under the adverse scenario. Under the baseline scenario, institutions would consistently increase their loan portfolios during the test period, while their sufficiently high profitability would still allow them to increase their already high CAR. Under the adverse scenario, capital increases would be most constrained by higher credit losses, which would amount to around €1.2 billion over the entire test period (around 4.2% of the total loan portfolio at the end of 2024). In the adverse scenario, net interest income would decline but still remain significant, which would offset credit losses at the financial system level.
Significant interest income would allow the banking system to absorb the increase in credit losses under the adverse scenario, resulting in an increase in the CAR under both the baseline and adverse scenarios.
Chart 22. Breakdown of financial market participants’ CAR under the baseline (B) and adverse (A) scenarios
Sources: Bank data and Lietuvos bankas’ calculations.
1.5.2.Bank liquidity assessment
The systemic liquidity risk in the Lithuanian banking sector is currently considered to be low, even against the backdrop of high uncertainty and significant volatility in global financial markets. The background of trade tensions is causing more pronounced volatility in USA and European equity and bond markets and is increasing the vulnerability of financial markets, which may lead to an increase in market liquidity in Europe and contagion risks in Lithuania. However, this risk is not significant as Lithuanian banks rely almost exclusively on deposit financing, while the share of market funding in Lithuania is significantly lower than in the euro area (currently accounting for just over 5%, whereas the euro area average is around 24%). The potential market liquidity risk is also mitigated by the very small share of the trading portfolio in the balance sheets of banks, which accounts for only one tenth of a percent.
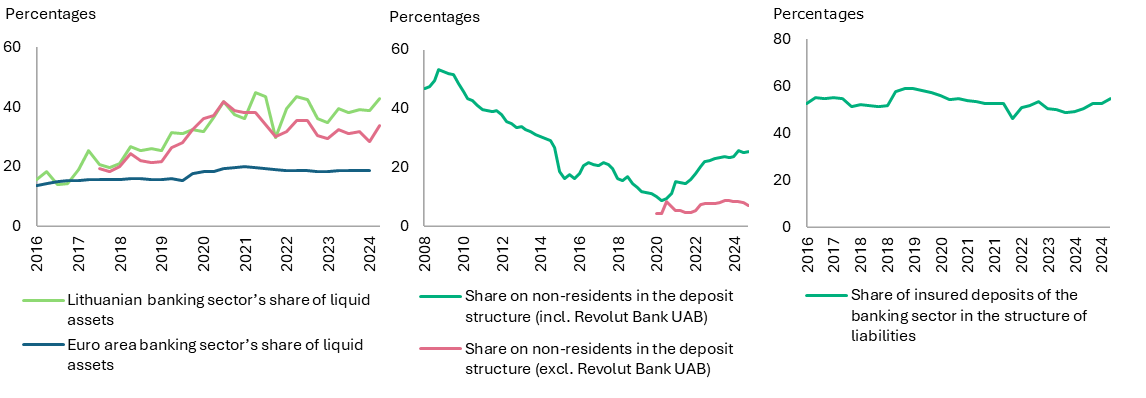
The sources of financing for the Lithuanian banking sector remained stable in 2024. The ratio of loans issued by banks to deposits held by Lithuanian residents increased marginally and stood at 81%. Meanwhile, the significant share of reserves held at the central bank (see Chart 23, left-hand panel), even with a decline in excess liquidity, ensures a stable source of liquidity. Banks in Lithuania rely almost exclusively on deposit financing, with deposits accounting for almost 90% of total liabilities. The potential risk of deposit outflows is mitigated by the small share of deposits of non-residents and the significant share of insured deposits (see Chart 23, central and right-hand panels). It should be noted that insured deposits account for around 50% of total liabilities and 60% of total deposits, which is higher than the euro area average (40% of total liabilities). The majority of deposits (around 93%, excluding Revolut Bank UAB, where the deposits of non-EU residents account for as much as 98% of total deposits) are deposits of Lithuanian residents, while a significant portion of the non-resident deposit portfolio consists of deposits attracted through deposit platforms from residents of other EU countries.
The banking sector’s liquidity buffers remain high, and their funding sources are resilient to fluctuations in global financial markets.
Chart 23. Banking sector’s share of liquid assets and funds with central banks (left-hand panel), share of non-residents in the deposit structure (central panel), and share of insured deposits in the structure of liabilities (right-hand panel)
Sources: Lietuvos bankas and ECB.
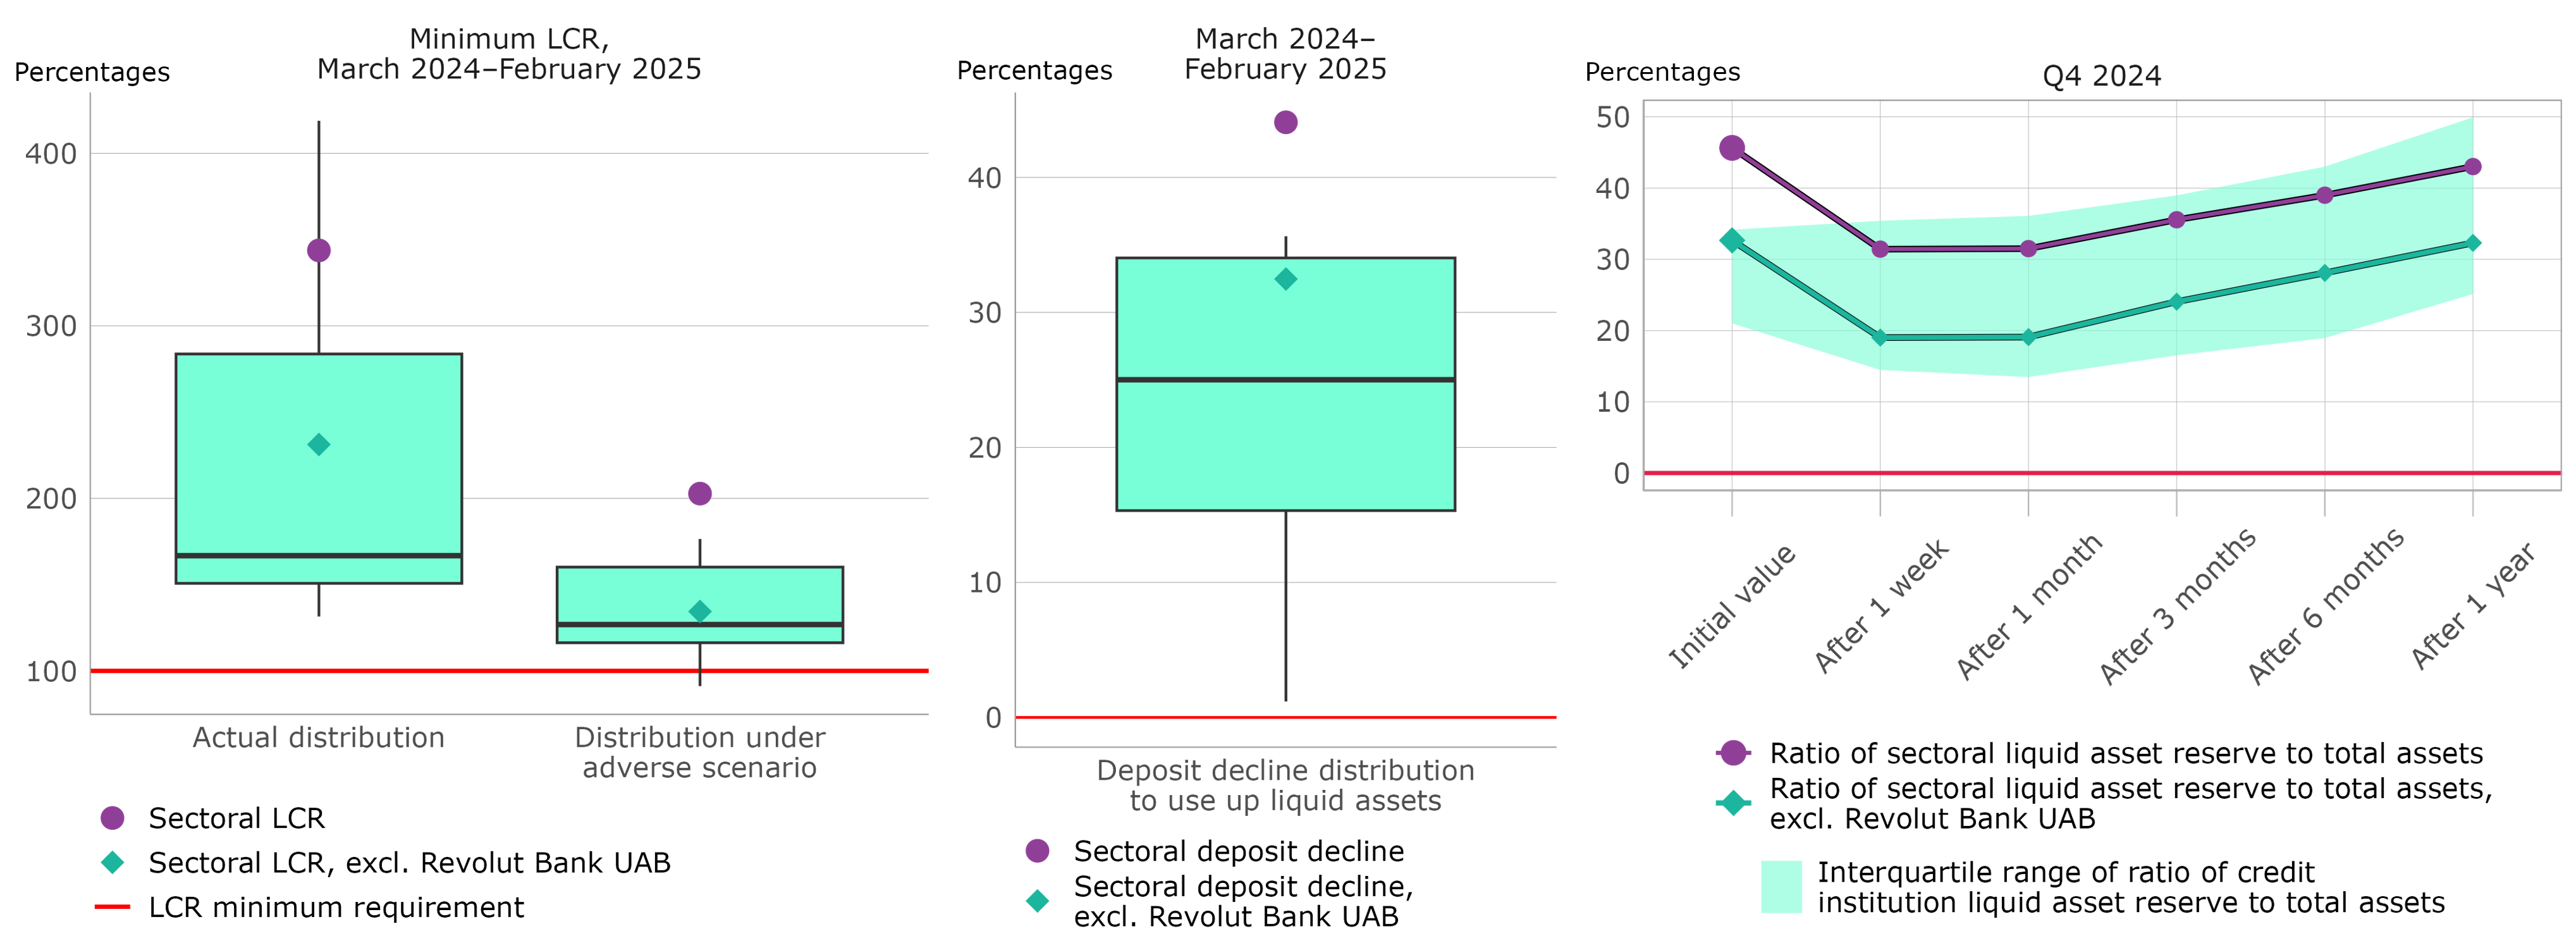
The system of banks and central credit union groups is characterised by a high degree of resilience to liquidity shocks, with most credit institutions able to withstand them with a margin.
Chart 24. LCR distribution in the system of banks and central credit union groups (left-hand panel), decline in deposits that credit institutions could withstand (central panel), and changes in the ratio of liquid assets to total assets under a three-month liquidity shock scenario (right-hand panel)
Sources: Bank data and Lietuvos bankas’ calculations.
Note: The minimum LCR distribution in the left-hand panel and the deposit decline distribution in the central panel show the breakdown of the minimum LCR and deposit decline values of individual credit institutions that would be required to use up their liquid assets over a one-year period from March 2024 to February 2025.
1.6.Trends in the non-banking sector
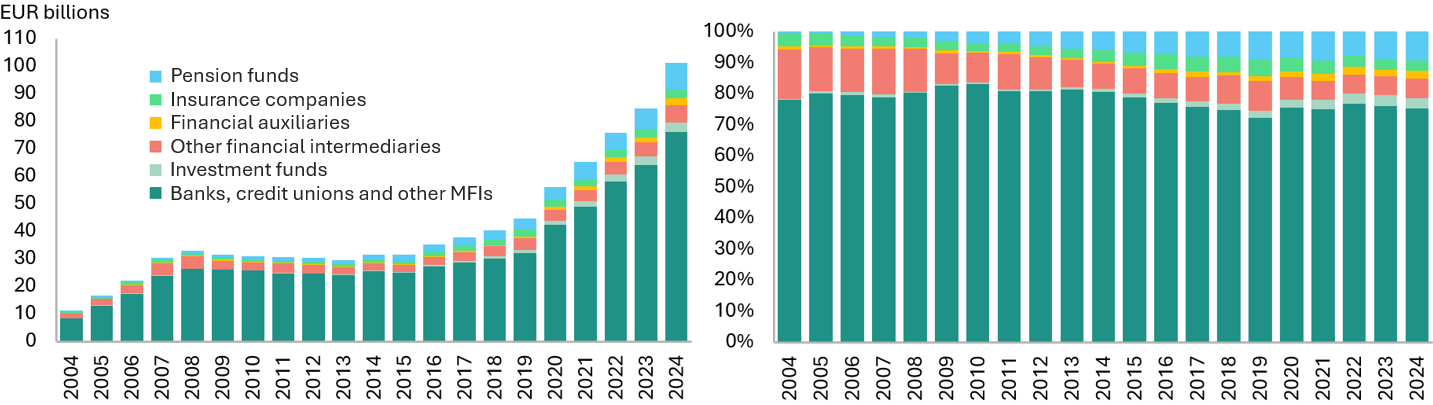
In 2024, pension funds in Lithuania increased the volume of managed assets to 9.4% of the total assets of the financial system (see Chart 25, left-hand and right-hand panels). For the second year in a row, the assets managed by growing pension funds increased significantly (21%) to €9 billion. The growth of pension funds was driven by the growing number of active participants (the number of participants in 2024 increased by 3.9% compared to 2023, with more active participation in the third pillar) and the increased success of investments, as last year’s average return of pension funds was 17%. Pension funds invested mostly (over 82%) in CIU units. Overall, the pension fund market in Lithuania grew steadily in 2024, but amendments to the pension fund system under consideration for 2025–2026 could significantly reduce the number of contributors and assets managed by pension funds.
The value of assets managed by investment funds increased by a fifth over the year, driven by both the growing number of fund participants and the rapid growth in the value of managed assets. At the end of 2024, investment funds managed a total of €3.5 billion in assets (of which €2 billion was managed as investments in RE, with the remainder mainly in the form of shares and bonds). The sector’s growth was supported by a large influx of new participants into the funds: for instance, the number of participants in CIUs and CIUFIIs rose by 63% and 17%, respectively, in 2024. Positive investment returns also increased the volume of assets under management, with the average value of fund units increasing by 20%, and the units of funds investing in equities saw the highest increase (36%). Overall, the investment fund sector is developing sustainably, and the low prevalence of open-ended investment funds significantly reduces the level of risk to the financial system (see Box 3 for more details).
In 2024, the volume of total assets managed by all types of financial institutions increased to over €100 billion.
Chart 25. Assets of financial institutions (left-hand panel), and share of financial institutions in the financial sector as a whole (right-hand panel)
Source: Lietuvos bankas.
Notes: The financial account data used exclude non-financial assets as well as holding companies. Financial auxiliaries include insurance brokers and agents, pension fund and CIU management companies, operators of crowdfunding and peer-to-peer lending platforms, etc. Other financial intermediaries include financial leasing companies, factoring companies, venture capital companies, etc.
In 2024, the insurance sector in Lithuania maintained its growth trend, with assets increasing by 7.5% over the year to almost €2 billion and the sector’s resilience remaining high. Total investment in the insurance sector grew by 8%, with no changes in the investment structure. Government securities accounted for almost 50% of investments, and investments in shares and CIUs accounted for slightly more than 33%. Compared to 2023, the largest increase was in investments in shares and CIUs, while the total amount of time deposits fell by the largest margin. The number of insurance contracts concluded during the year rose by 4%. In 2024, there were no loss-making insurance companies and the sector’s total profit for the year increased by 36.6%. The majority of the profit (more than 67%) was earned by non-life insurance companies whose insurance portfolios consisted mainly of property insurance in terms of insurance premiums (motor vehicles, housing, etc.). All insurance companies met solvency capital requirements: compared to 2023, solvency ratios remained stable and stood at 1.5 in the non-life insurance sector and 2 in the life insurance sector in 2024. Overall, the insurance sector remained resilient and diversified in 2024 and continued to strengthen its role in the Lithuanian financial system.
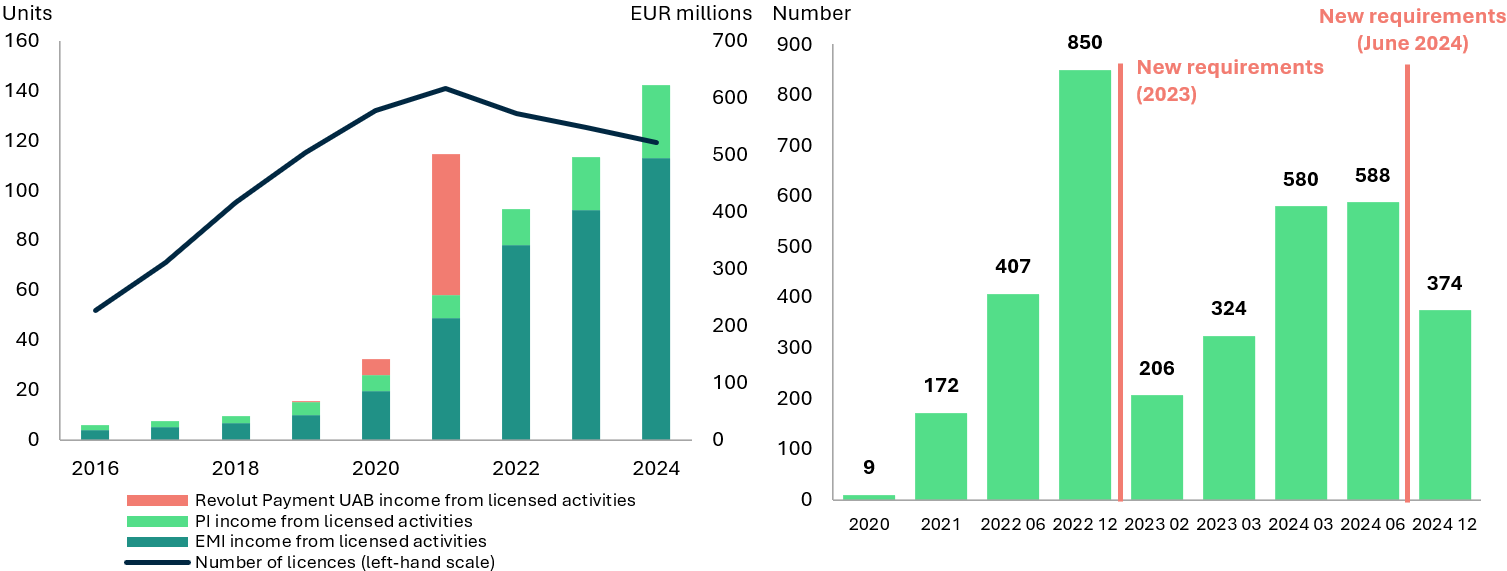
The fintech sector continued to grow, with the decline in the number of market participants offset by the expansion of existing companies in the sector. Despite the decline in the number of participants in the sector (from 125 to 119), the financial capacity of fintech companies continued to grow significantly in 2024: compared to the previous year, the sector’s income from licensed activities increased by a quarter (see Chart 26, left-hand panel), slightly more than half of the companies in the sector were profitable, and the value of payment transactions amounted to €152 billion, up 33% over the year. However, the total value of payments sent and received by the sector still accounted for a relatively small share of the total financial system and stood at 5.2% at the end of 2024 (a decrease of 3.7 percentage points from the end of 2022). The majority of payment transactions in the sector were international: the share of international payments sent and received by EMIs and PIs accounted for 17.9% of total international payments in the financial market at the end of 2024. The increasing maturity of institutions in the sector is demonstrated by the fact that, for the first time, all institutions complied with the own funds requirements at the end of the year (CAR was above 1.1), while the ratio for eight institutions ranged between 1 and 1.1.
The crypto-asset sector in Lithuania is in a transitional period, with more applications being submitted for operating licences, while the risks posed by the sector’s lack of maturity are mitigated by its limited links with the banking sector. Although the requirements of the EU MiCA Regulation entered into force on 30 December 2024, some additional requirements have applied since 30 June 2024. As a result of these changes and other additional requirements, the sector shrank from 588 service providers in mid-2024 to 374 companies at the end of the year (see Chart 26, right-hand panel). Most EU countries, including Lithuania, decided to apply a transitional period during which institutions in the sector could apply to Lietuvos bankas for licences. Although the application process was sluggish at the beginning of the year, 20 applications had already been filed by March, and up to 40 applications are expected by the end of the transitional period on 1 June 2025. The sector’s lack of maturity, the risk of fraud, and the evasion of sanctions remain the most pressing challenges for the financial system. There is growing interest among households in Europe in purchasing crypto-assets, and the increasing availability of regulated products related to crypto-assets may encourage traditional financial market participants to invest there in the future. However, the link between the crypto-asset sector and the banking sector remains limited in Lithuania and across Europe, while the implementation of the MiCA Regulation will contribute significantly to increasing the resilience of institutions in the sector and preventing risks.
The fintech sector has continued its financial expansion, while the crypto-asset sector has been affected by a reduction in the number of service providers and a transitional period for licensing.
Chart 26. Income of fintech companies from licensed activities and number of licences (left-hand panel), and number of crypto-asset service providers in Lithuania (right-hand panel)
Sources: State Data Agency and State Enterprise Centre of Registers.
Note: In the left-hand panel, Revolut Payments UAB is no longer a member of this sector as of 1 July 2022 and is classified in the banking sector as Revolut Bank UAB.
2.Improving financial stability
Since 2014, Lietuvos bankas has been given a macroprudential policy mandate to strengthen the stability of the financial system as a whole. Macroprudential policy allows for the early detection of threats to the financial system and the adoption of appropriate measures to manage these risks. Therefore, Lietuvos bankas continuously assesses the adequacy of macroprudential policy measures used in Lithuania (see Chart 27) and regularly reviews the levels of these measures. Lietuvos bankas also actively seeks to respond to factors hindering the efficiency of the Lithuanian financial system that have an adverse effect on the balanced development of the financial system or financial inclusion. To this end, Lietuvos bankas proposes amendments to legal acts and formulates positions on relevant issues.
2.1. Application of macroprudential measures
Applicable capital buffers increase the resilience of banks to unforeseen shocks, and RLR measures protect consumers from being overburdened by financial liabilities.
Chart 27. Macroprudential policy measures applied in Lithuania
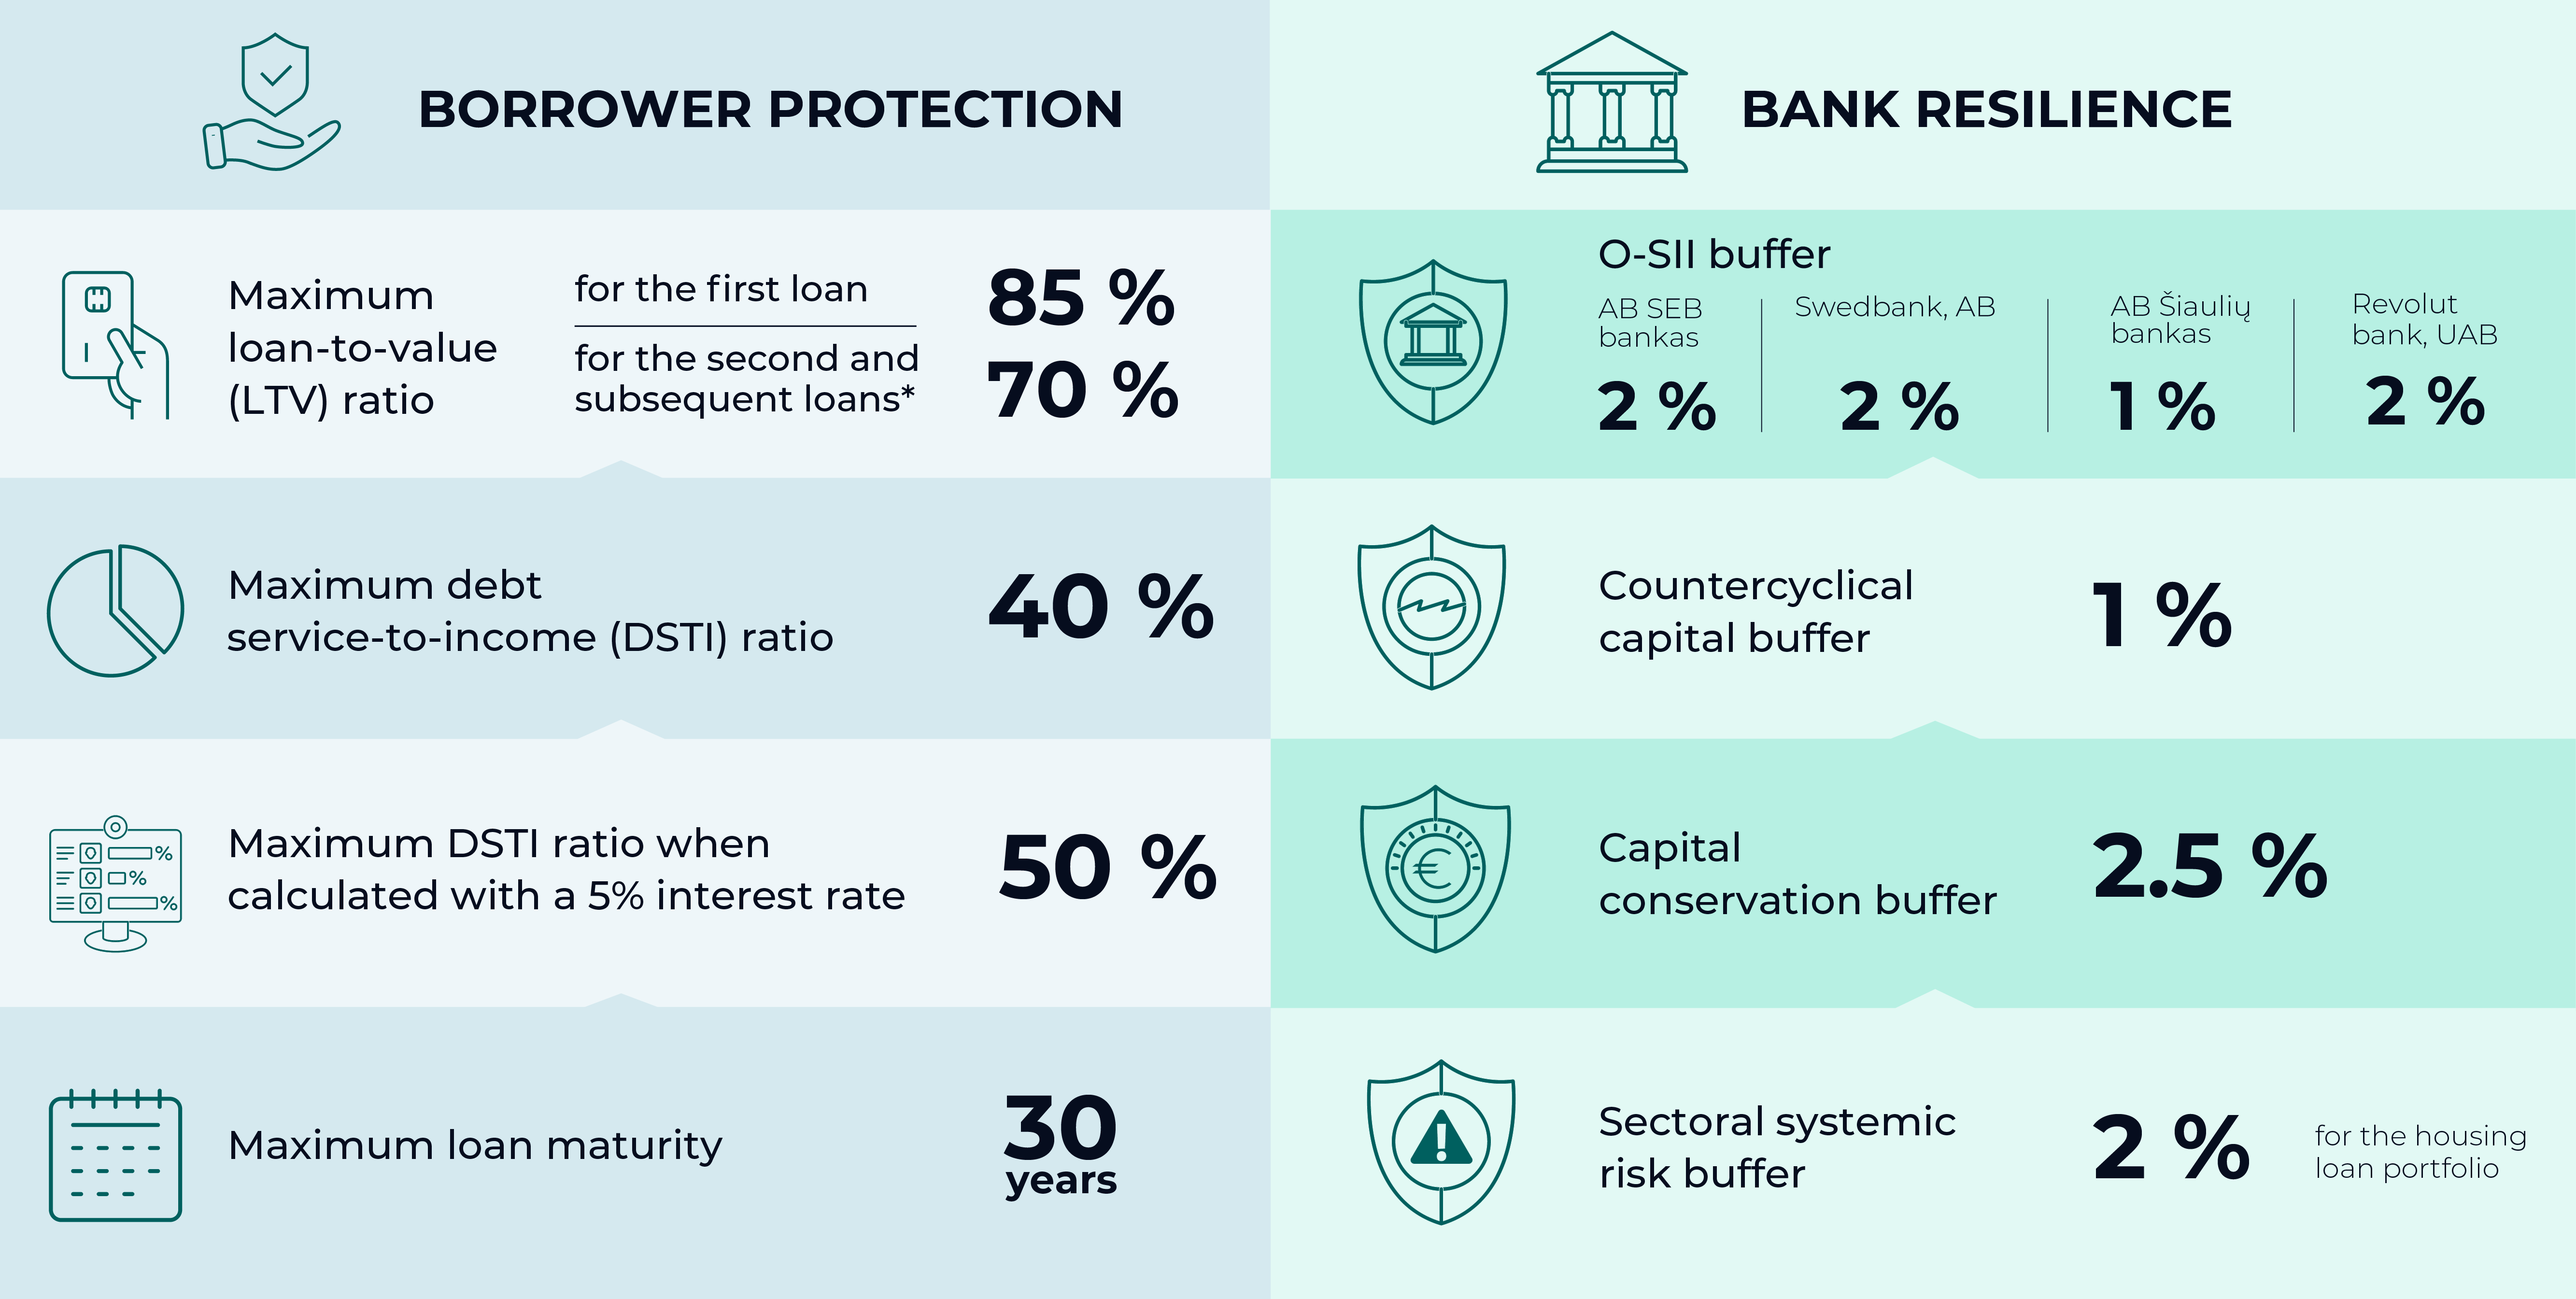
* The exemption to this requirement will only be granted in cases where the outstanding amount of each previously taken loan is lower than 50% of the value of housing purchased using that loan.
Lithuania has an average level of combined capital buffer requirement compared to other European countries, while the banks meet the existing requirements with a margin.
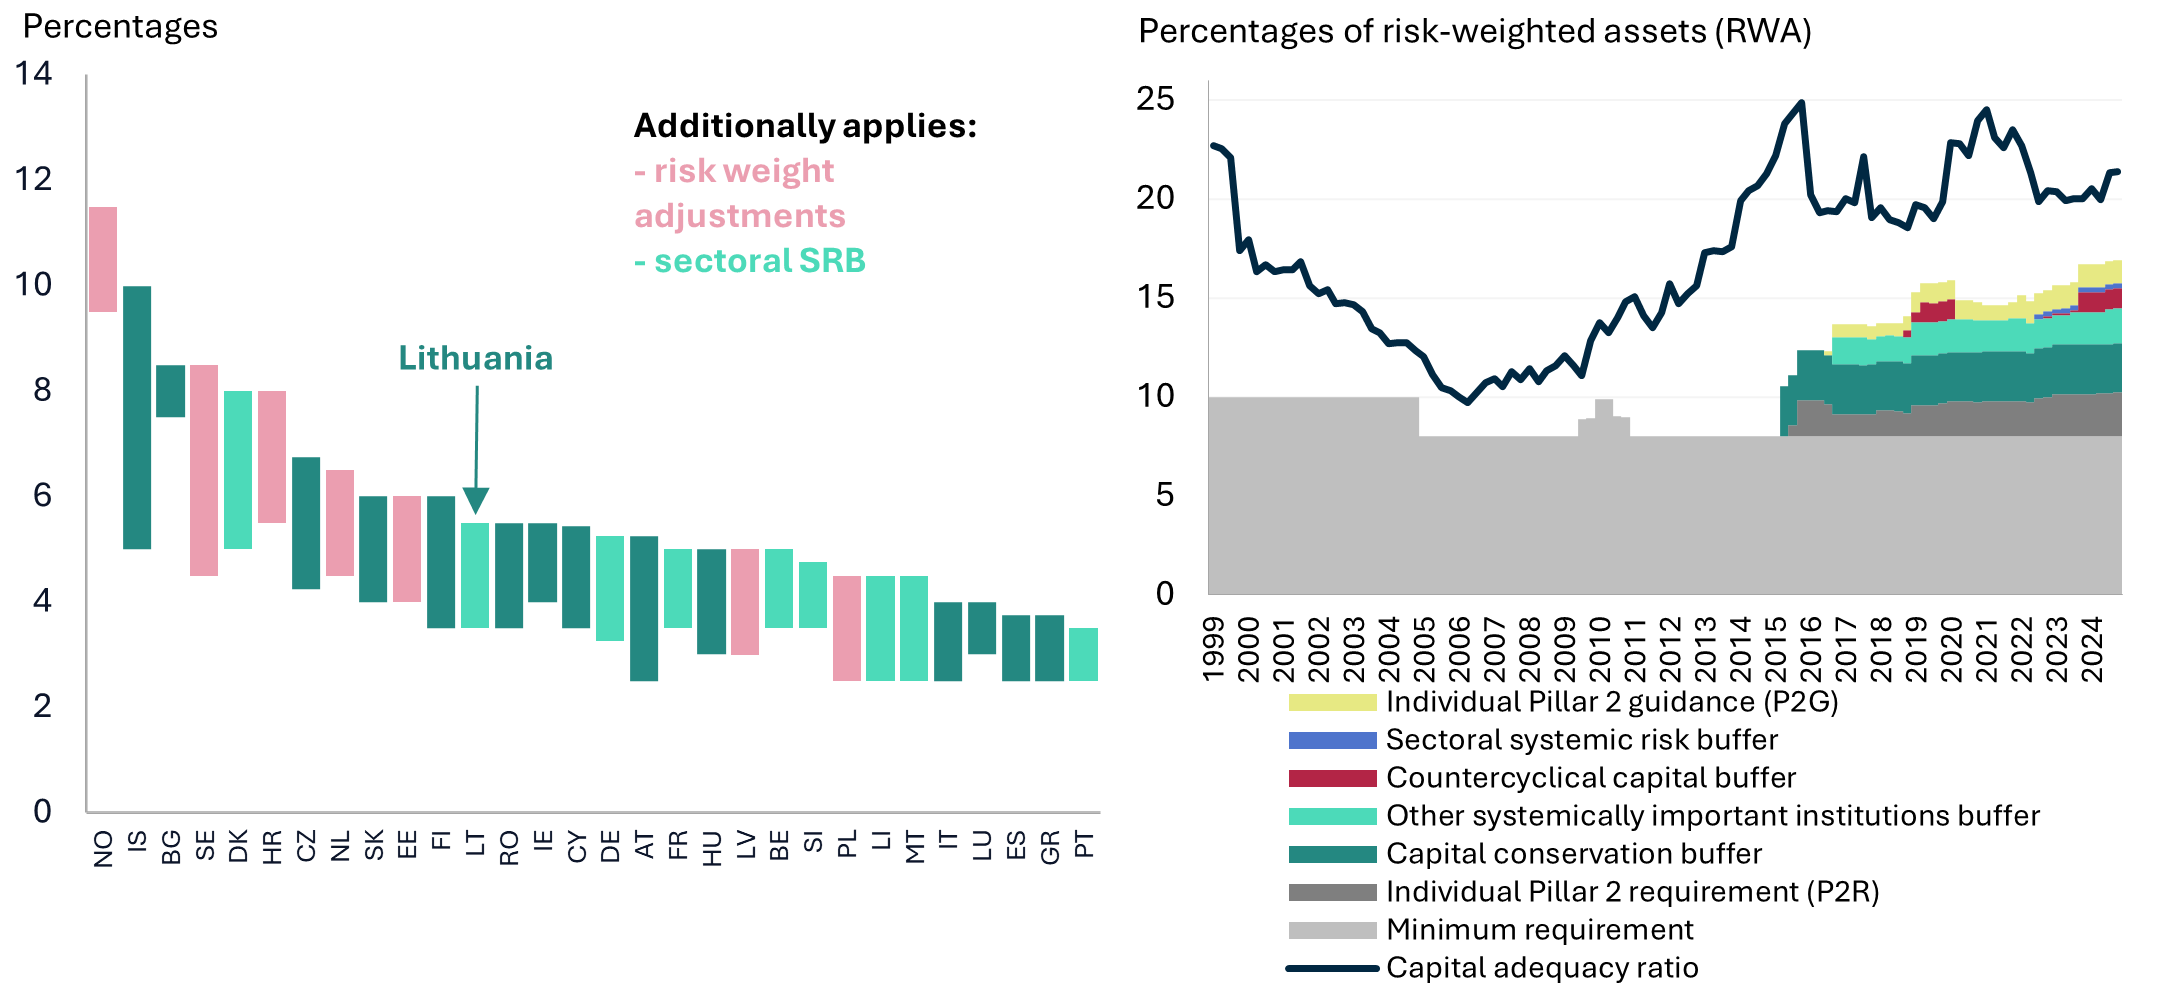
Sources: European Systemic Risk Board and Lietuvos bankas.
Note: In the left-hand panel, the spread of the combined capital buffer illustrates the distribution of macroprudential capital requirements applicable to individual banks operating in specific countries. The lower distribution value indicates the value of the bank with the lowest combined capital buffer requirement in that country, while the upper value indicates the value of the bank with the highest combined capital buffer requirement in that country.
As interest rates begin to recede, the average LTV and DSTI ratios for new housing loans are moving closer to their long-term averages. In addition, this scenario causes interest expenses to account for a progressively smaller share of monthly loan payments, allowing a larger share to be allocated to loan repayment, which enables households to borrow more even if their income remains unchanged. In January–February 2025, the average DSTI for new housing loans was 29.9%, down 2 percentage points from December 2023, when the DSTI reached its highest level in the last interest rate hike cycle (see Chart 29, central panel). With interest expenses declining and the DSTI requirement becoming less of a factor limiting the maximum available loan, households can borrow more and purchase the same housing by contributing less of their own funds. In January–February 2025, the LTV of new housing loans was around 74.2%, up 2.5 percentage points from December 2023, when the lowest LTV level since the start of the interest rate hike cycle was observed (see Chart 29, left-hand panel).
As 2024 saw interest rates decline, the flow of second and subsequent housing loans increased. In 2024, the annual growth of the flow of new second and subsequent housing loans reached around 18% (see Chart 29, right-hand panel), and these loans accounted for around 21% of the total flow of new housing loans in January–February 2025, up around 8 percentage points from the average flow of 2024. The DSTI of residents taking out a second or subsequent loan is often higher than that of residents taking out their first loan, and they are more sensitive to changes in interest rates, so when interest rates start to fall, it is likely that some residents seeking to take out a second loan may be able to borrow larger amounts.
As interest rates declined, the LTV and DSTI of new housing loans in 2024 approached the levels prevailing before the interest rate increase.
Chart 29. LTV ratio of new housing loans (left-hand panel), DSTI ratio (central panel), and loan flow by number of loans and housing units (right-hand panel)
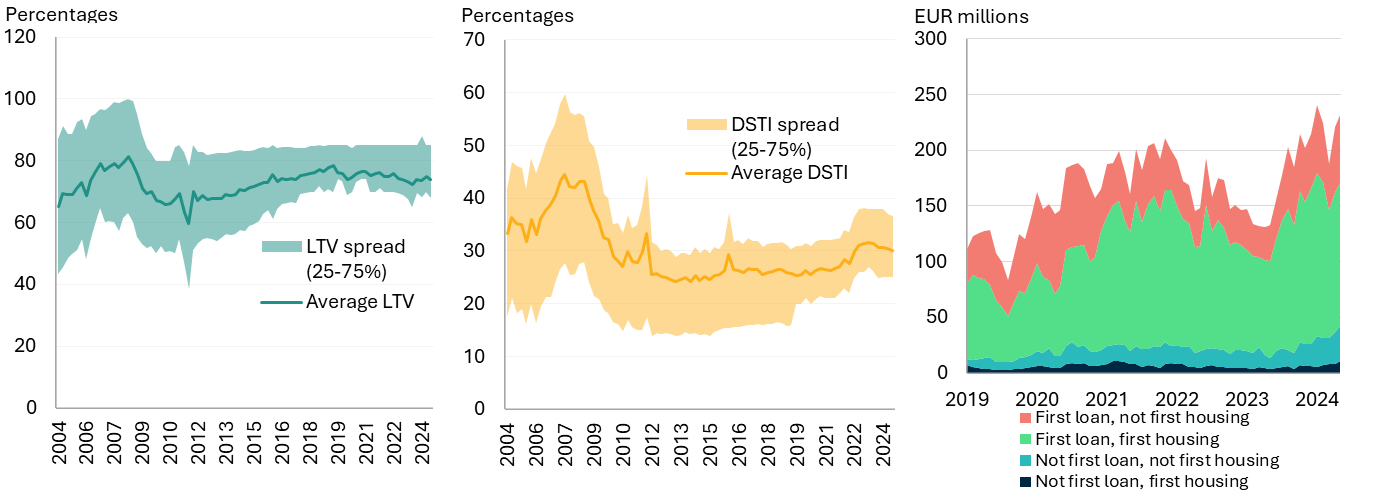
Source: LRDB.
2.2. Other measures proposed by Lietuvos bankas for the financial sector
Legal amendments initiated by Lietuvos bankas have created favourable conditions for the mobility of housing loan holders and strengthened their bargaining power when renegotiating with lenders on the terms of existing loans. Following the entry into force of the amendments, the refinancing process has become simpler for consumers (lenders are required to exchange the necessary information directly, without involving the consumer) and free of charge (lenders can no longer charge their fees and must cover the fees charged by third parties such as notaries and registries) in most cases. The simplification of refinancing is also already having a significant impact on the ability of consumers to seek a reassessment and reduction of the interest rate on their existing housing loan without changing their credit provider. Initial lenders, knowing that the customer does not face significant obstacles to refinance their housing loan with another lender, often have an interest in retaining the existing customer and renegotiating loan terms to be more favourable for consumers. Thus, the balance of bargaining power has shifted significantly in favour of consumers, which is conducive to stronger competition among lenders.
On 1 May 2025, amendments to the Republic of Lithuania Real Estate Related Credit came into force, requiring lenders to offer customers at least two types of interest rates when offering housing loans: a variable rate and fixed rate for at least five years. This requirement applies to lenders with a housing loan portfolio of more than €50 million, and the different interest rate options must be tailored to the individual (or joint borrowers). This requirement will ensure that consumers have a real, rather than theoretical, choice of the type of interest rate that is most acceptable to them. The amendments to this law also stipulate that lenders will have to regularly (on the date of the loan interest rate change) inform borrowers about the prevailing lending conditions on the market. These regulatory requirements, together with the approved simplified refinancing procedure, help address inefficiencies in the housing loan market due to structural and other reasons and ensure better consumer protection in the financial services sector, as well as sustainable contribution of the financial system to economic growth.
Residents are actively taking advantage of the opportunities offered by the simplified refinancing procedure, which has led to a significant increase in the volume of loan renegotiations and refinancing. Since February 2025, when the amendments to the Republic of Lithuania Law on Real Estate Related Credit came into force, there has been a significant increase in the number of both renegotiations with current lenders and loans refinanced at other banks. The volume of renegotiations in February and March jumped by more than 50% compared to January, with more than 10,000 loans with a total value of over €700 million renegotiated, accounting for 5.4% of the total housing loan portfolio. Compared to the monthly average of last year, the volume of renegotiations increased by several times. This trend has been observed since the beginning of 2024, when the amendments to the refinancing procedure were initiated. Since then, almost a fifth of the total housing loan portfolio has been renegotiated. In February, compared to January, the number of refinanced loans increased threefold, and in March it doubled again and was four times higher than the monthly average of 2024. As the refinancing process itself may take some time, it is likely that the impact of the refinancing processes initiated in February and March will become more apparent in the coming months.
By refinancing their loans and renegotiating with current lenders, consumers significantly improved their housing loan terms. In February–March 2025, consumers renegotiated their loan terms and reduced their margins by 0.3–0.35 percentage points on average, which will allow them to save up to €4,000 on average over the entire loan period. Residents who refinanced their loans also significantly reduced their margins (by an average of 0.5 percentage points) and will be able to save up to €7,000 on average over the entire loan period. In total, more than 25,000 consumers already took advantage of loan refinancing or renegotiation on more favourable terms between 2024 and March 2025, which will save them a total of €150 million over the entire loan period (see Chart A).
Since 1 February, more than 10,000 consumers have refinanced their housing loans or renegotiated their terms with their current lenders.
Chart A. Impact of changes to the simplified refinancing procedure
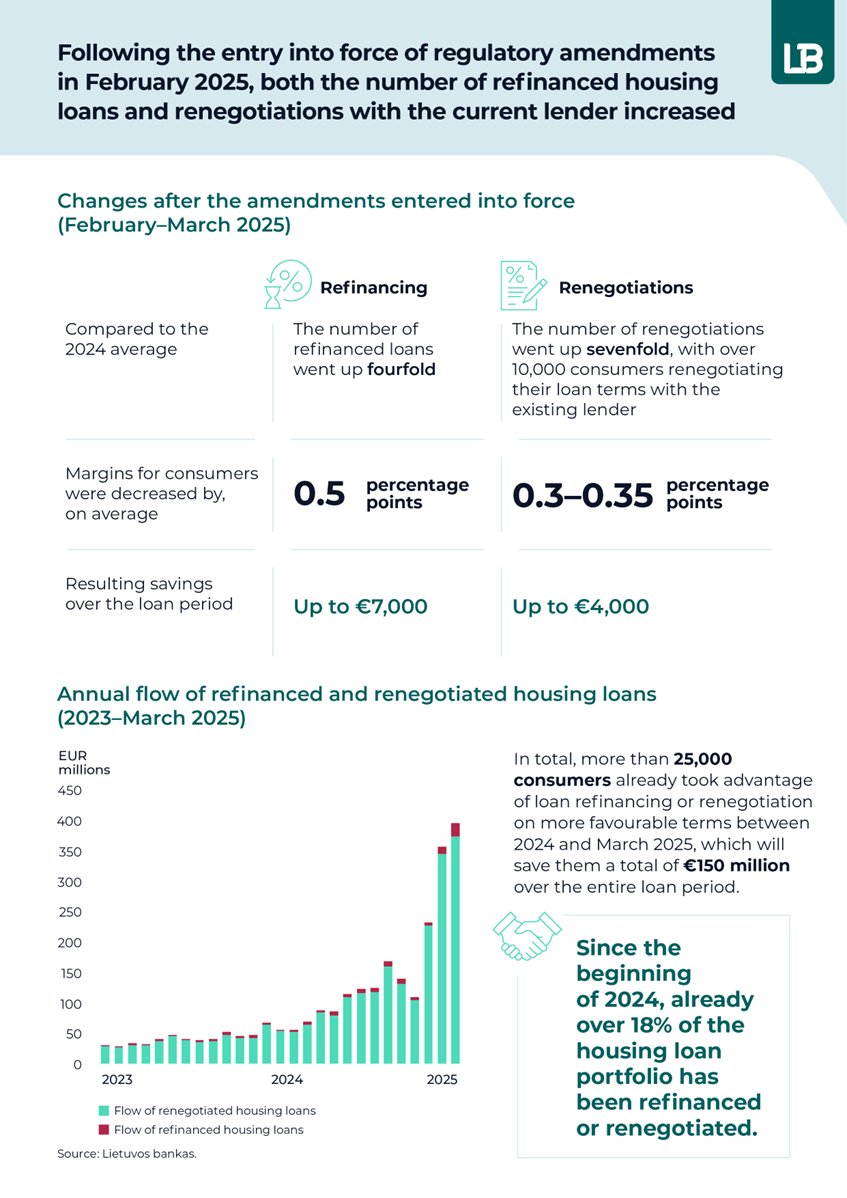
Source: Lietuvos bankas.
Abbreviations
AB public limited liability company
AML/CTF anti-money laundering and counter-terrorist financing
CAR capital adequacy ratio
CCyB counter-cyclical capital buffer
CIU collective investment undertaking
CMC Capital Market Council
CRE commercial real estate
DSTI ratio debt service-to-income ratio
EC European Commission
ECB European Central Bank
EMI electronic money institution
ESCB European System of Central Banks
EU European Union
fintech financial technology
FMP financial market participant
GDP gross domestic product
HICP Harmonised Index of Consumer Prices
IMF International Monetary Fund
IT information technology
LB RSHPI repeat sales house price index of Lietuvos bankas
LRDB Loan Risk Database
LTV loan-to-value ratio
MFI monetary financial institution
MiCA Regulation Markets in Crypto-Assets Regulation
PF pension fund
PI payment institution
PSP payment service provider
RE real estate
RLR Responsible Lending Regulations
SDA State Data Agency
SME small- and medium-sized enterprise
SRB systemic risk buffer
UAB private limited liability company
UK United Kingdom
USA United States of America
|
© Lietuvos bankas Gedimino pr. 6, LT-01103 Vilnius The Financial Stability Review looks at the developments in the banking sector, companies and households and the situation in RE markets, identifies the key risks and challenges that could affect the operation of Lithuania’s financial system, especially banks, and the financial system’s ability to withstand shocks. The material presented in this review is the result of statistical data analysis, modelling and expert assessment. The review is prepared by Lietuvos bankas. The cut-off date for the data used in the publication is 1 May. Reproduction for educational and non-commercial purposes is permitted provided that the source is acknowledged. ISSN 1822-5241 (online) |