
2026-03-31

Lietuvos bankas published the provisional data on direct investment (DI) for the fourth quarter of 2025. According to the latest data release:
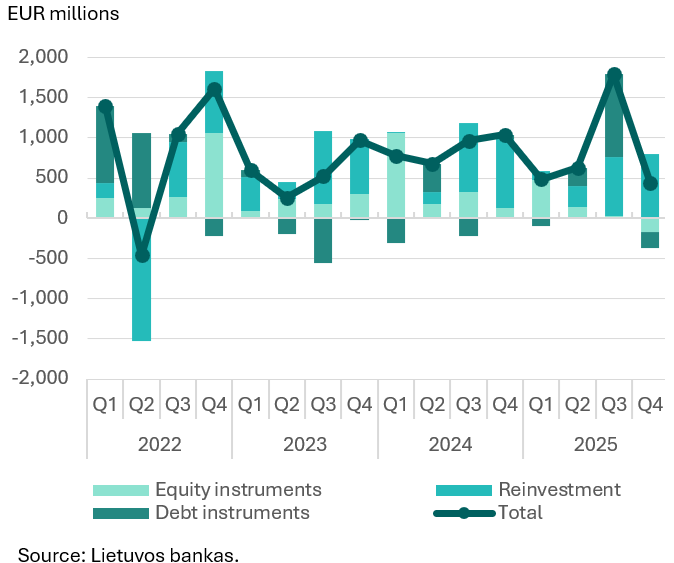
the foreign direct investment (FDI) flow in Lithuania went down in the fourth quarter of 2025 by 58.1% compared to the same period in 2024 and amounted to €434.1 million (see Chart 1). This development was conditioned by repayments of debt instruments (€199.3 billion) and a decline in investments of equity instruments (€171.7 million). The largest flows to Lithuania were recorded from the United Kingdom (€452.3 million), Germany (€264 million), and the United States (€181.6 million), while negative flows came from Luxembourg (€327.5 million), the Netherlands (€309.8 million), and Cyprus (€265.7 million). In terms of economic activity, increased investments in financial and insurance activities (€380.6 million), wholesale and retail trade, repair of motor vehicles and motorcycles (€142.2 million) were the ones to stand out, while investments in professional, scientific, and technical activities (€497.6 million) decreased;
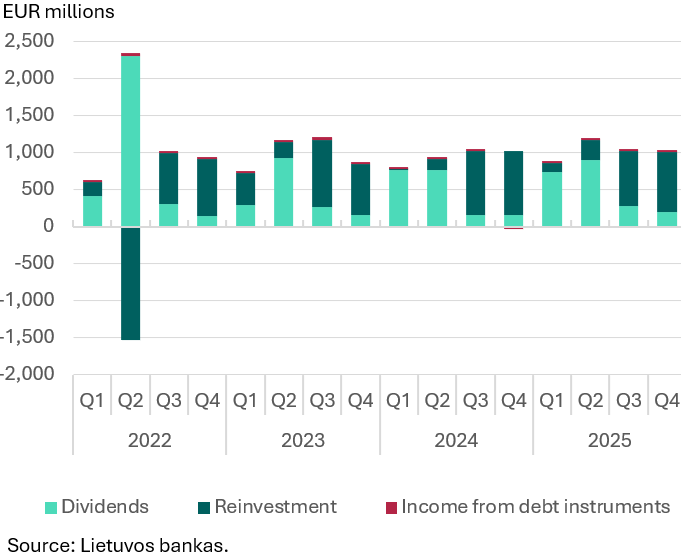
FDI income from non-resident investment increased by 2.9% in Q4 2025, compared to the same period of 2024, and amounted to €1 billion. The bulk of FDI income was reinvested (€805.1 million) (see Chart 2). The largest reinvestments were made by investors from Finland (€180.6 million), Sweden (€134.3 million), and the Netherlands (€90.8 million). In terms of economic activity, the highest income was earned by companies engaged in wholesale and retail trade as well as in repair of motor vehicles and motorcycles (€284.1 million);
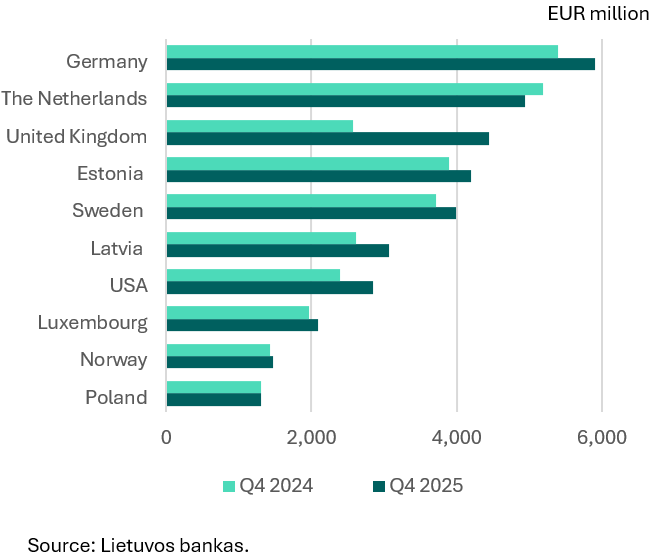
cumulative FDI in Lithuania rose by 10.1% over the year and, as at 31 December 2025, stood at €43.8 billion, accounting for 52.1% of the gross domestic product. FDI per capita in Lithuania amounted to an average of €15,166 (as at 31 December 2024 – to €13,752). The largest investors in Lithuania were from Germany (€5.9 billion), the Netherlands (€4.9 billion), the United Kingdom (€4.4 billion), Estonia (€4.2 billion), and Sweden (€4 billion) (see Chart 3). Financial and insurance businesses attracted the most FDI (€15.6 billion), with investments in these sectors increasing by 12.6% over the year;
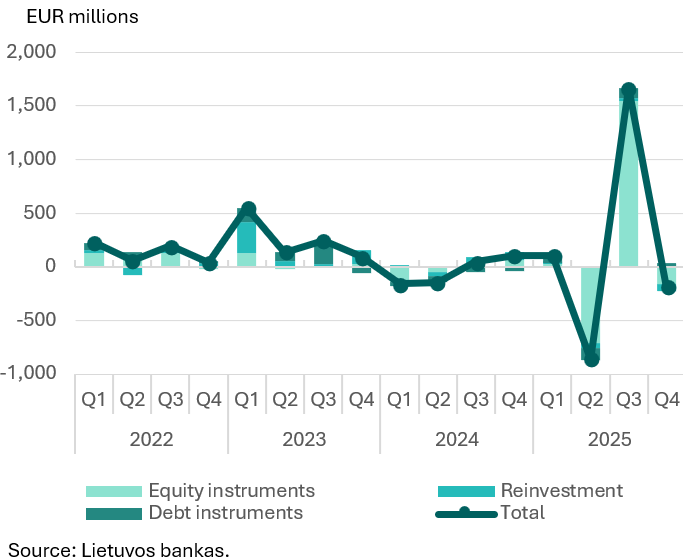
the flow of Lithuania’s DI abroad was negative and totalled €192.6 million over the period under review. This was driven by a decline in investments by Lithuanian residents in foreign equity instruments (€160.8 billion) (see Chart 4). The largest investment flows were directed to Norway (€111.9 million), while the largest negative flows were recorded in Poland (€149 million) and Latvia (€81.2 million). In terms of economic activity, a notable increase in investments was observed in manufacturing enterprises (€245.5 million), while investments decreased in companies engaged in professional, scientific, and technical activities (€199.7 million) and information and communication activities (€105.1 million);
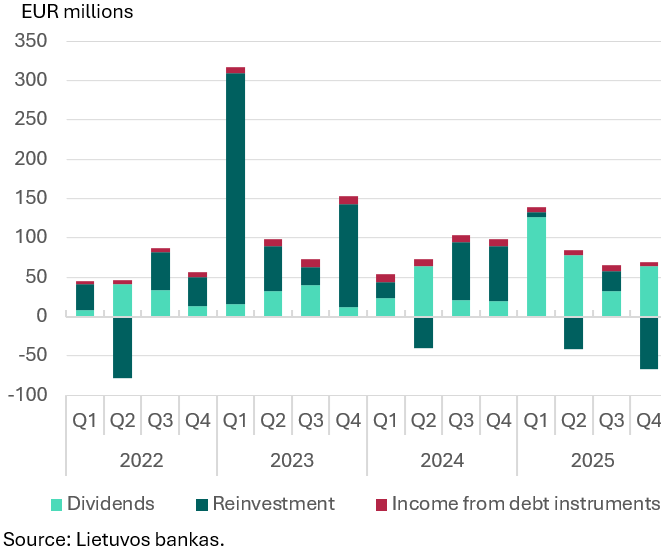
DI income earned by Lithuanian investors abroad amounted to €2.3 million in Q4 2025. The decline in income was due to negative reinvestments (€67.1 million) and dividends paid (€63.9 million) (see Chart 5). Most of the income was generated from investments in Latvia (€72.5 million) and Poland (€29.4 million), while losses were recorded from investments in the U.S. and Sweden – €68.4 million and €41.3 million, respectively; in terms of economic activity, the highest income was generated by manufacturing enterprises (€67.7 million), while negative income was recorded by enterprises engaged in information and communications activities (€105.6 million);
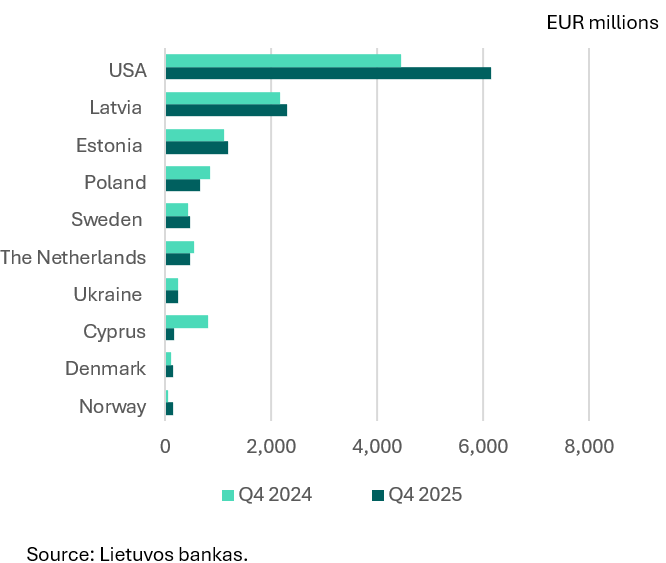
as at 31 December 2025, Lithuania’s cumulative DI abroad stood at €13.2, of which 47% was in the EU Member States. The main directions of Lithuania’s DI abroad are the USA (€6.2 billion), Latvia (€2.3 billion), and Estonia (€1.2 billion), accounting for 46.6%, 17.5%, and 9% of Lithuania’s total DI abroad, respectively (see Chart 6). The largest share of Lithuania’s cumulative DI abroad (46.7% or €6.2 billion) went to enterprises engaged in professional, scientific and technical activities.
| Chart 1. FDI flow in Lithuania | Chart 2. Non-resident FDI income | |
 |
 |
|
Chart 3. TOP 10 cumulative FDI in Lithuania |
Chart 4. Lithuania’s DI flow abroad |
|
 |
 |
|
Chart 5. Lithuania’s DI income abroad |
Chart 6. TOP 10 Lithuania’s cumulative DI abroad |
|
 |
 |
When calculating the data for the fourth quarter of 2025, the data for the first to third quarters of 2025 were revised. Detailed data on DI are available on the website of Lietuvos bankas under External statistics.
Use the My Data Sets tool to create your own data sets, which are saved in your account and automatically updated as soon as they are published.
Download in PDF (123.9 KB download icon)