
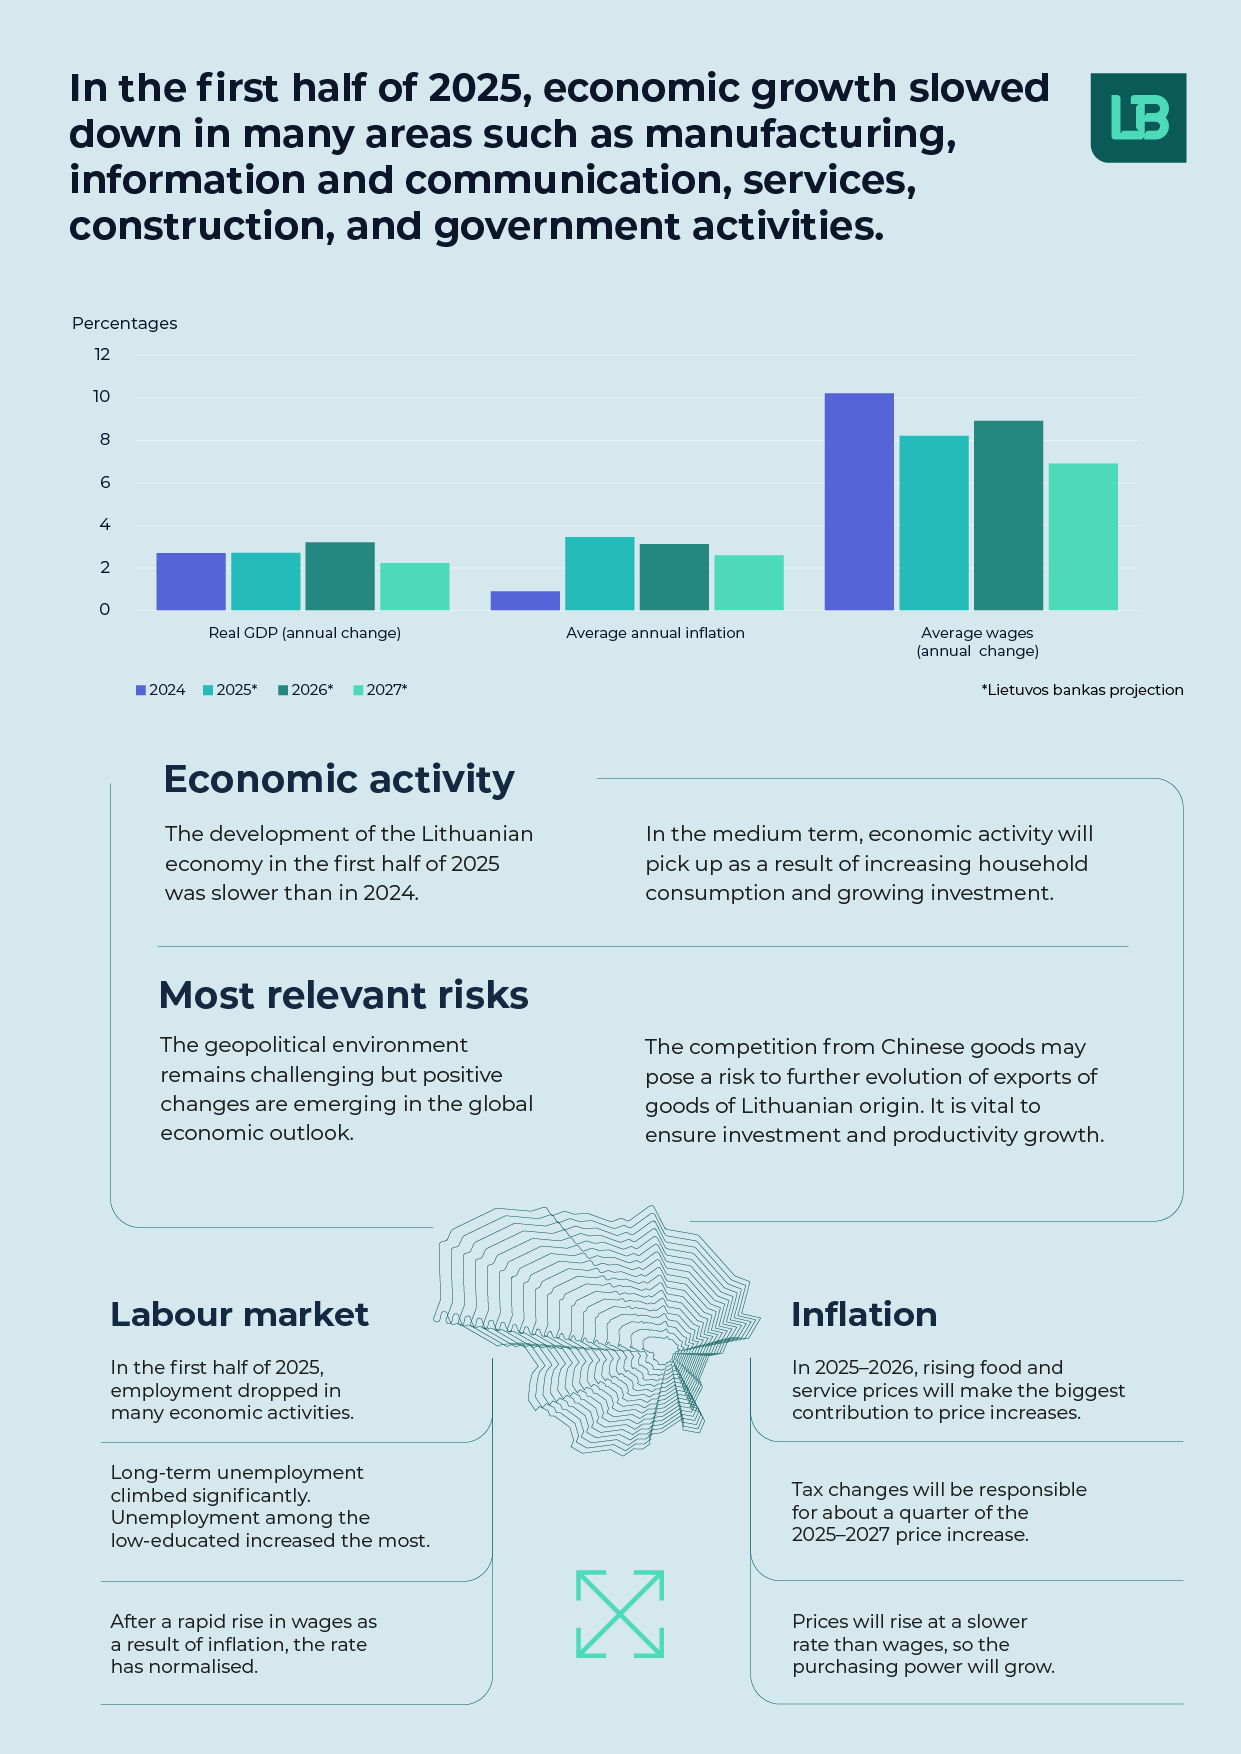
Lithuania’s economic development and outlook
Following changes in US trade policy, the global economy continues to grow, but its development is rather uneven. Customs tariffs on US imports have not increased to the extent discussed, although the associated uncertainty has had, and continues to have, an impact on the economies of many countries. Fears of a significant rise in US customs tariffs led to inventory build-up in the country, which had a positive impact on production and exports in various regions of the world in the first months of this year. For a while, the growth of international trade stimulated investment and contributed to the recovery of stock markets. After a sluggish start to the year, the situation in the services sectors improved in most countries. The relatively good situation in the labour markets, the less negative than feared impact of higher customs tariffs, and the waning impact of the previously tightened monetary policy had a favourable effect on service-oriented economic activities. However, the short-term outlook for the global economy is less positive. The surge in manufacturing and international trade was likely short-lived. In the second half of the year, the tradable sector may face more challenges due to emerging trade restrictions, hence the outlook for international trade for the coming quarters is cautious and has been slightly revised down.
Inflation rate is expected to remain higher in the near term. It is projected to stand at 3.5% and 3.1% in 2025 and 2026, respectively. In addition to the previously planned increase in indirect taxes, next year inflation will be affected by tax changes adopted in June 2025. The impact of all tax changes on inflation next year could reach 1.2 percentage points. In 2026, inflation will also be driven by the partial withdrawal of residents from the SPPF. At the same time, inflation is expected to be suppressed by falling energy prices and stagnant food commodity prices. Labour costs will have no greater impact on inflation than they have had recently. In the long run, with the reduced impact of tax increases, the waning effect of price-increasing withdrawals from the SPPF, and lower growth in labour costs, inflation rate is expected to fall. It is projected to stand at 2.6% in 2027.
Outlook for Lithuania’s economy
|
September 2025 projectiona |
June 2025 projection |
|||||||
|
2025b |
2026b |
2027b |
2025b |
2026b |
2027b |
|||
|
Price and cost developments (annual percentage change) |
||||||||
|
Average annual HICP inflatione |
3.5 |
3.1 |
2.6 |
3.3 |
2.5 |
2.6 |
||
|
GDP deflatorc |
3.6 |
3.3 |
2.9 |
3.3 |
3.2 |
3.1 |
||
|
Wages |
8.2 |
8.9 |
6.9 |
8.7 |
8.3 |
7.7 |
||
|
Import deflatorc |
-0.5 |
1.3 |
2.3 |
0.6 |
1.8 |
2.5 |
||
|
Export deflatorc |
0.1 |
1.4 |
2.3 |
0.2 |
2.1 |
2.5 |
||
|
Economic activity (constant prices; annual percentage change) |
||||||||
|
GDPc |
2.7 |
3.2 |
2.3 |
2.8 |
2.8 |
2.9 |
||
|
Private consumption expenditurec |
2.2 |
6.0 |
0.8 |
3.8 |
4.0 |
3.7 |
||
|
General government consumption expenditurec |
0.9 |
0.1 |
0.1 |
0.5 |
0.1 |
0.1 |
||
|
Gross fixed capital formationc |
5.7 |
5.4 |
3.4 |
6.9 |
5.2 |
3.5 |
||
|
Exports of goods and servicesc |
3.8 |
2.0 |
3.4 |
3.3 |
2.7 |
3.5 |
||
|
Imports of goods and servicesc |
5.2 |
3.4 |
2.5 |
6.9 |
2.8 |
3.5 |
||
|
Labour market |
||||||||
|
Unemployment rate (annual average as a percentage of labour force) |
7.1 |
6.6 |
6.5 |
6.7 |
6.6 |
6.5 |
||
|
Employment (%, annual percentage change)d |
-0.2 |
0.1 |
-0.3 |
0.3 |
-0.3 |
-0.2 |
||
|
External sector (percentage of GDP) |
||||||||
|
Balance of goods and services |
4,6 |
3,7 |
4,3 |
2,5 |
2,6 |
2,6 |
||
|
Current account balance |
1,4 |
0,4 |
0,8 |
-0,4 |
-0,5 |
-0,8 |
||
|
Current and capital account balance |
3,6 |
2,2 |
1,6 |
1,9 |
1,3 |
0,0 |
||
a The macroeconomic projections are based on external assumptions, constructed using information made available by 15 August 2025, and other data and information made available by 1 September 2025.
b Projection.
c Adjusted for seasonal and workday effects.
d National accounts data; employment in domestic concept.
e Harmonised Index of Consumer Prices.
1.International environment
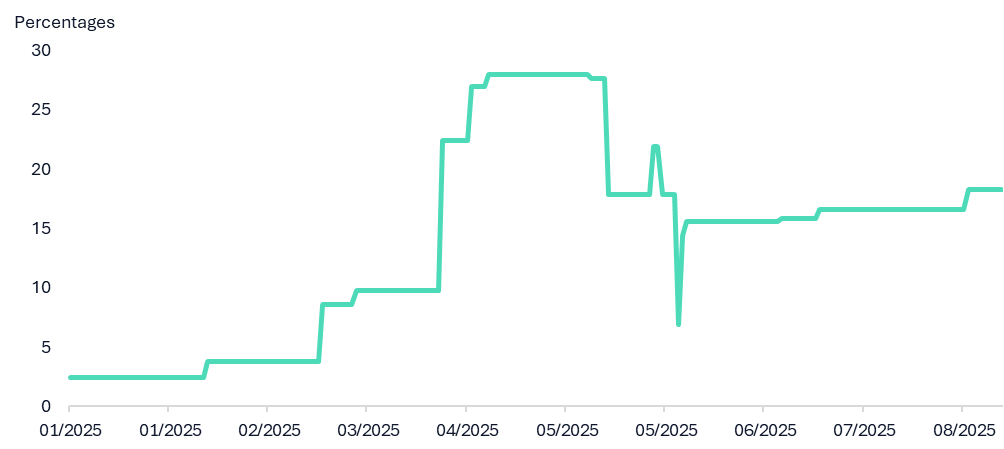
The US effective import tariff rate has fallen from its peak in April.
Chart 1. US effective import tariff rate
Source: The Budget Lab at Yale.
China’s growth outlook has been revised upwards as the turmoil caused by the US trade policy subsided, but the country continues to face challenges from weak domestic demand. The growth projection for this year (the July projection compared to the April estimate) has been significantly revised upwards by 0.8 percentage points (to 4.8%) mainly due to a stronger than expected economic growth at the beginning of the year. The main factor behind the upward revision was a pick-up in exports boosted by the efforts of US companies to frontload imports, China’s ability to redirect its exports to Asia and other markets, as well as the ceasefire reached in the trade war. However, growth will slow to 4.2% next year. China’s main problem will remain weak domestic demand due to the slump in the property market. Meanwhile, growth will be dampened by higher US tariffs than before. A faster economic development could be expected if fiscal measures to stimulate consumption were expanded.
2.Real sector
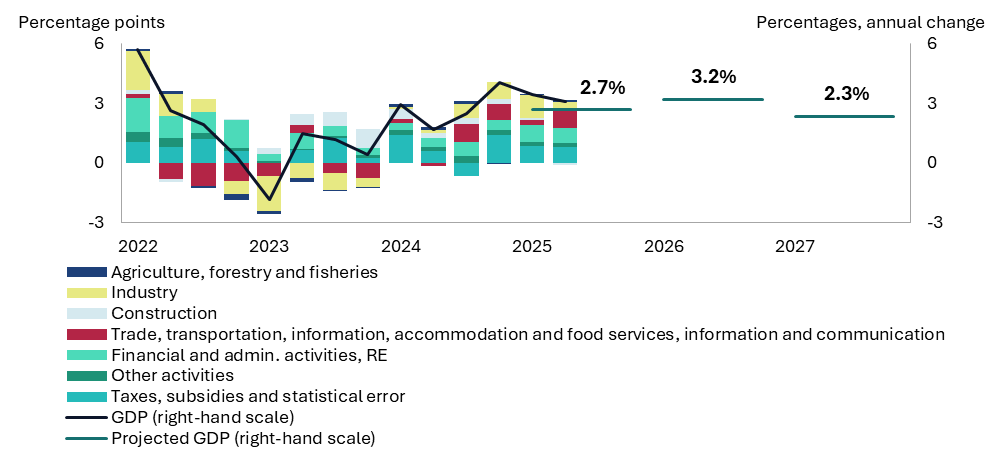
In the first half of 2025, the Lithuanian economy continued to grow, albeit at a slower pace. The State Data Agency estimates that the annual growth rate was 3.2% in the first quarter and 3.1% in the second quarter (the quarterly growth rate was 0.6% and 0.3% respectively). The industrial, trade, and information and communication sectors were the main contributors to growth in the first half of the year (see Chart 2). However, slower growth of construction, agriculture, and government-related activities prevented growth from continuing at the same rapid pace as before. In the first quarter, industrial output grew at its fastest pace since the onset of the war in Ukraine, but in the second quarter industrial growth was hampered by the suspension of production at AB Achema and declining oil refining sales. The chemical industry and machinery with various equipment contributed most to the growth of Lithuanian exports. Exports of goods, however, grew more slowly than the historical average due to weaker demand growth in major trading partners and, according to Lithuanian companies, declining competitive edge. Growth in the construction sector remained robust at the beginning of the year, but a moderation of growth was already recorded in the second quarter due to falling volumes of civil engineering. Construction activity in the first half of the year was mainly supported by construction work abroad, with the volume remaining at historical highs, while the number of construction works in Lithuania has remained virtually unchanged since 2024. Retail trade was in the negative territory at the beginning of the year, but the sector bounced back in the second quarter, with turnover growing and reaching its peak in June. Information and communication, real estate operations, and transport activities contributed to the positive growth of the market services sector, but business surveys indicate that demand has been declining in recent months causing businesses to be more cautious about their future prospects. Overall, economic development in the first half of 2025 was supported by strong domestic demand, rising purchasing power, and investment.
Lithuania’s economic growth is expected to strengthen in the second half of this year. This will be driven by gradually increasing external demand, purchasing power of the population, and the softening impact of the previously tight monetary policy. In 2026, the economy will be further boosted by higher household consumption due to the 2nd pillar pension reform. However, this effect will be short-lived and economic growth will slow significantly in 2027. Economic growth is also expected to be slightly dampened by tax changes and higher international trade tariffs during the projection horizon. Real GDP is projected to grow by 2.7% in 2025, rise to 3.2% in 2026 due to the 2nd pillar pension reform and decline to 2.3% in 2027 (see Chart 2).
In the first half of 2025, the Lithuanian economy continued to grow, albeit at a slower pace.
Chart 2. GDP developments and contributions (by production approach)
Sources: State Data Agency and Lietuvos bankas calculations.
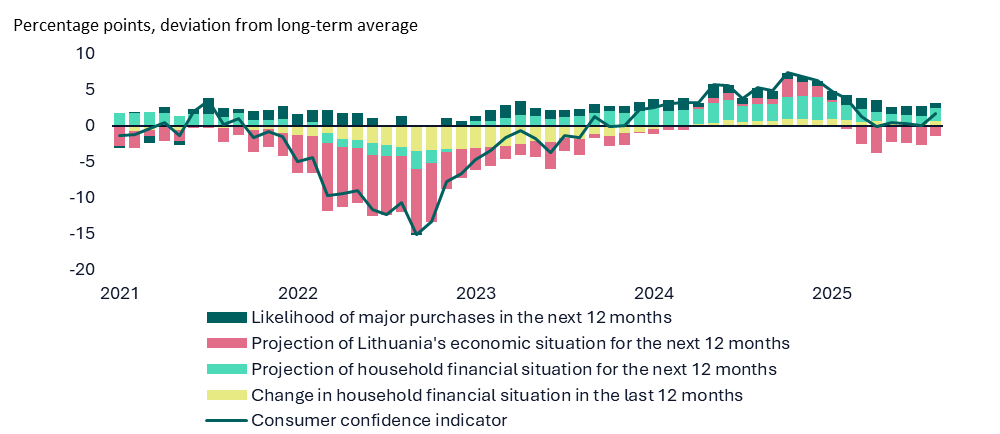
After a temporary decline due to a brief spike in inflation and tax changes at the beginning of the year, household consumption returned to growth in the second quarter of this year. Annual household consumption growth slowed to 0.5% in the first quarter of this year before rebounding to 3.1% in the second quarter. In the first quarter, tax changes and a brief spike in inflation affected the purchasing power and buying habits of consumers, which also had a significant impact on retail trade performance at the beginning of the year. The introduction of a new carbon component of the excise duty in 2025 raised energy prices. This had an impact on fuel sales: the amount of gas oil declared fell by 16.3% in the first half of this year, while that of petrol increased by 3.5%. In the second quarter, sales of the trade sector recovered, with the fastest growth recorded by clothing, footwear and online sales, as well as fuel sales. Household consumption expenditure also went up supported, among other factors, by continued growth of the purchasing power, with real wages rising by 8.4% in the first half of the year. Nevertheless, surveys of the population indicate a deterioration of expectations, with consumer confidence dropping in the second quarter to its lowest level since the end of 2023. Households expect the economic situation in Lithuania and their own financial situation to worsen, which may lead to more cautious consumption decisions in the near future. However, the confidence indicator improved noticeably in August, suggesting some signs of recovery (see Chart 3). Household consumption growth is expected to reach 2.2% in 2025 and temporarily increase to 6.0% in 2026 due to the implementation of the 2nd pillar pension reform. However, due to base effects, growth will be significantly slower in 2027, at merely 0.8%.
Chart 3. Consumer confidence indicator.
Sources: European Commission, State Data Agency and Lietuvos bankas calculations.
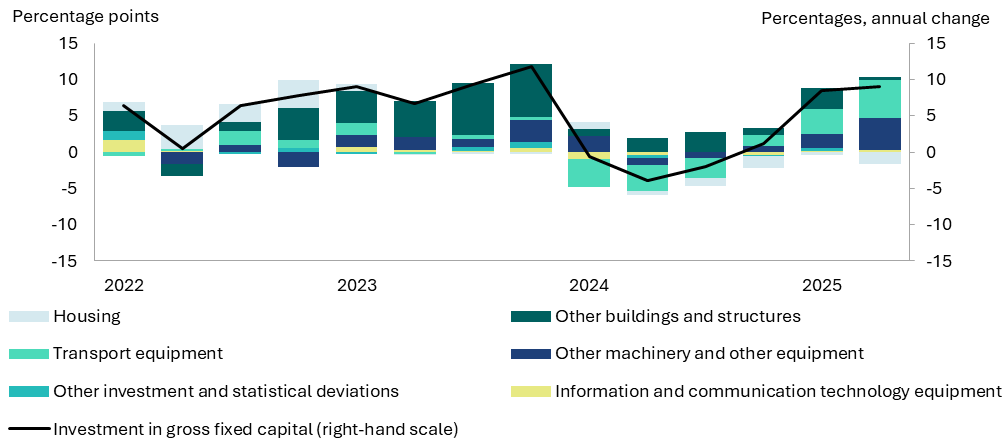
Investment has been one of the key factors supporting economic growth this year. It grew by 7.6% year on year in the first quarter of this year and by 9.1% in the second quarter. Investment in transport vehicles, machinery and equipment contributed most to this growth (see Chart 4), which indicates efforts by businesses to renew their production potential and increase efficiency. The results of the business investment trend survey show that industrial companies invested in replacing worn-out equipment, modernising production, and increasing production capacity in 2025, with demand for manufactured products remaining the main driver of investment. Corporate investment in production modernisation is expected to have a positive impact on corporate competitiveness. Investment in non-residential buildings also rose significantly, with the largest increase recorded in completed state-owned buildings such as cultural and sports facilities as well as hospitals. Despite the easing of monetary policy, investment in residential buildings is declining. Data on building permits issued or construction projects started do not indicate any significant growth in this type of investment in the near future. Government investment fell by 7.5% in the first quarter and likely contributed to the decline in the volume of civil engineering construction. Investment is forecast to grow by 5.7% in 2025, 3.2% in 2026, and 2.3% in 2027 (see Chart 4).
Chart 4. Investment contributions
Sources: State Data Agency and Lietuvos bankas calculations.
Prepared by Laura Mociūnaitė
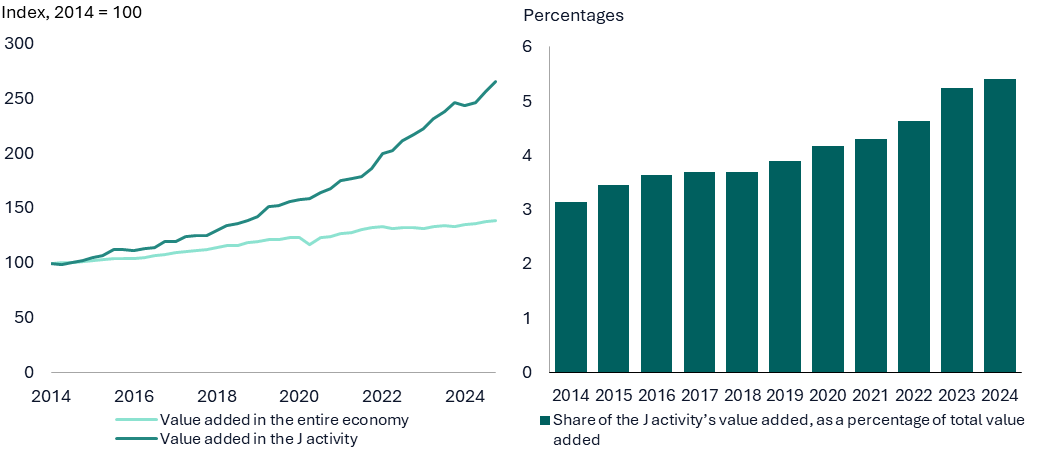
Over the last decade, the value added generated by the information and communication (J) activity increased 2.5 times, while the share of the activity in the Lithuanian economy almost doubled during this period. In 2024, the activity accounted for 5.4% of the total value added created in Lithuania (see Chart A). Overall, the information and communication was the fastest growing economic activity in Lithuania over the past three years and contributed significantly to the growth of the economy as a whole. The share of employed persons in the activity compared to the total number of employed persons increased 2.7 times during this period and stood at 4.8% in 2024. Given the growing importance of the information and communication activity, the box analyses the activity in order to identify the reasons for its breakthrough.
In recent years, the information and communication has been the fastest growing economic activity in Lithuania.
Chart A. Development of the value added of the information and communication activity (left-hand panel) and its share in total value added (right-hand panel)
Sources: State Data Agency and Lietuvos bankas calculations.
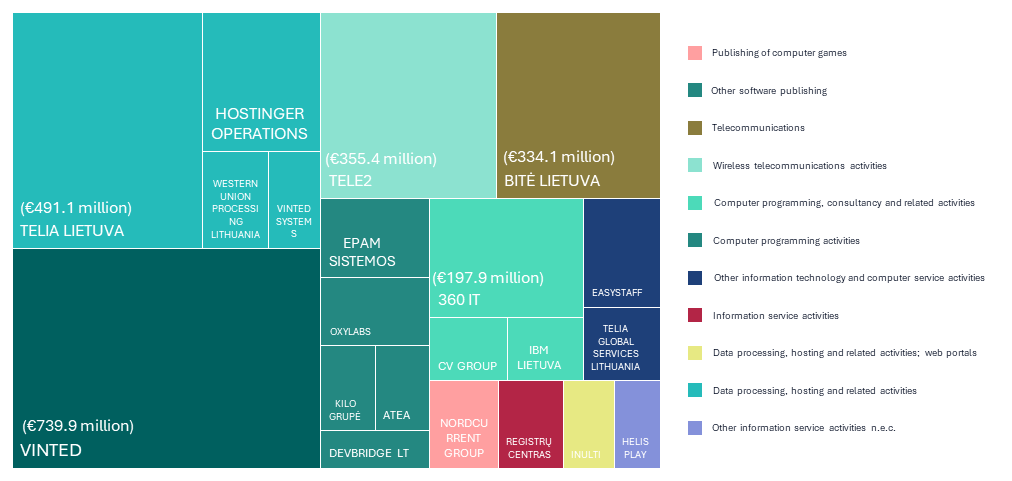
Five largest information and communication companies generated about one-third of the activity’s revenue in 2024.
Chart B. Top companies in the J activity generating 50% of total revenue of the J activity in 2024
Sources: State Social Insurance Fund, State Enterprise Centre of Registers and Lietuvos bankas calculations.
Notes: Based on the data from the income statements of companies submitted to the State Enterprise Centre of Registers, which were available on 21 July. Based on the classification of companies into activities in force during the reference year.
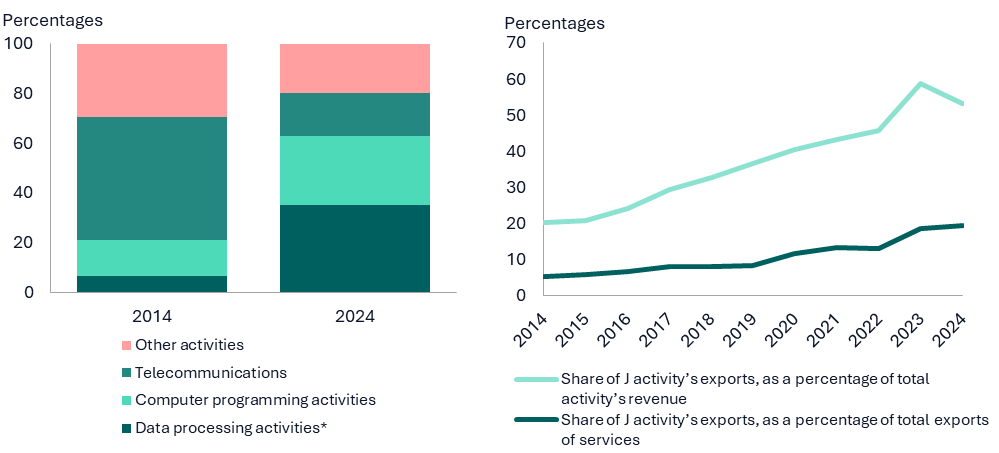
Over the decade, the structure of the information and communication activity became more export-oriented. A decade ago, the J activity was dominated by telecommunication services, which were more oriented towards the local market. In 2014, sales revenue from telecommunication activity accounted for around half of the total sales revenue of the activity (see Chart C, left-hand panel). In 2024, the share of this industry fell by a factor of around 3. In contrast, the shares of data processing and computer programming increased significantly. In 2024, it was data processing, hosting and related activities, web portal services activities that accounted for the largest share in the J activity (35%), followed relatively closely by computer programming activities (28%, see Chart C, left-hand panel). The special nature of software and digital services allow for a relatively rapid entry into foreign markets increasing the weight of services exports. This structure of information and communication activities is more export-oriented and favourable for future growth.
A decade ago, the information and communication activity was dominated by more domestically-oriented activities, whereas nowadays it is dominated by export-oriented activities.
Chart C. Structure of sales revenues of the J activity in 2014 and 2024 (left-hand panel) and dynamics of the export share of the J activity
Sources: State Data Agency, Lietuvos bankas and Lietuvos bankas calculations.
Note: Abbreviated name of the activity.
The development of the information and communication activity has also been driven by foreign direct investment, which almost tripled over the last decade. The arrival of large international market players, such as the Lithuanian branch of Barclays Group Operations Limited, has enabled employees to benefit from on-the-job training. Overall, foreign direct investment has facilitated the employment of experienced staff, attraction of investment, and growth for Lithuanian-capital companies such as Vinted, UAB. The experience gained in raising investment and expansion to export markets has fed through to other successful companies. With the rapid growth of Lithuanian-capital companies, the share of foreign direct investment, compared to the value added of the information and communication activity, fell by about one-fifth over the last decade and stood at 58% in 2024. This means that there is less risk of companies moving abroad as labour costs rise.
The ability to offer innovative and quality services that respond to market changes (e.g. increased cyber threats, data volumes, e-commerce volumes, and the need for sustainability) and to compete successfully with foreign service providers has enabled Lithuanian companies to develop and gain a footing on foreign markets. Rising export volumes have contributed to the strong growth of the information and communication activity, while the changed and more export-oriented structure of the industry is conducive to its further growth.
Prepared by Ernestas Virbickas
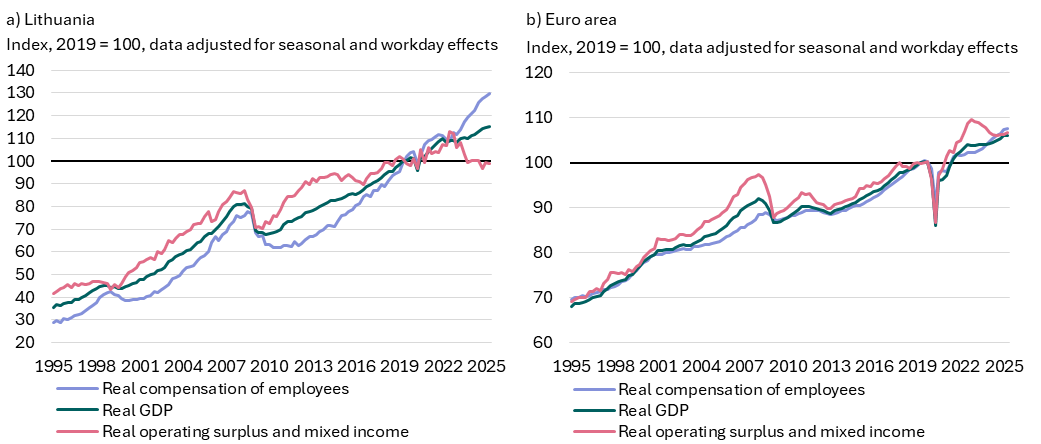
In this box, the real operating surplus of the whole economy is calculated by dividing the gross operating surplus and gross mixed income by the GDP deflator.
Despite the economic growth, the income generated by the capital employed, or the real operating surplus, has been falling in Lithuania.
Chart A. Real GDP, compensation of employees and operating surplus in Lithuania and euro area
Sources: Eurostat and Lietuvos bankas calculations.
In the long run, as the economy grows, the real operating surplus tends to increase as well. In 1995–2019, i.e. before the shocks of recent years, it accounted for around one-third of Lithuania’s real GDP growth. It contributed roughly by the same margin to real GDP growth in the euro area. Both in Lithuania and many other countries, the real operating surplus fluctuates more than the overall economic activity, partly due to the considerable inertia of real labour costs which account for a significant share of value added.
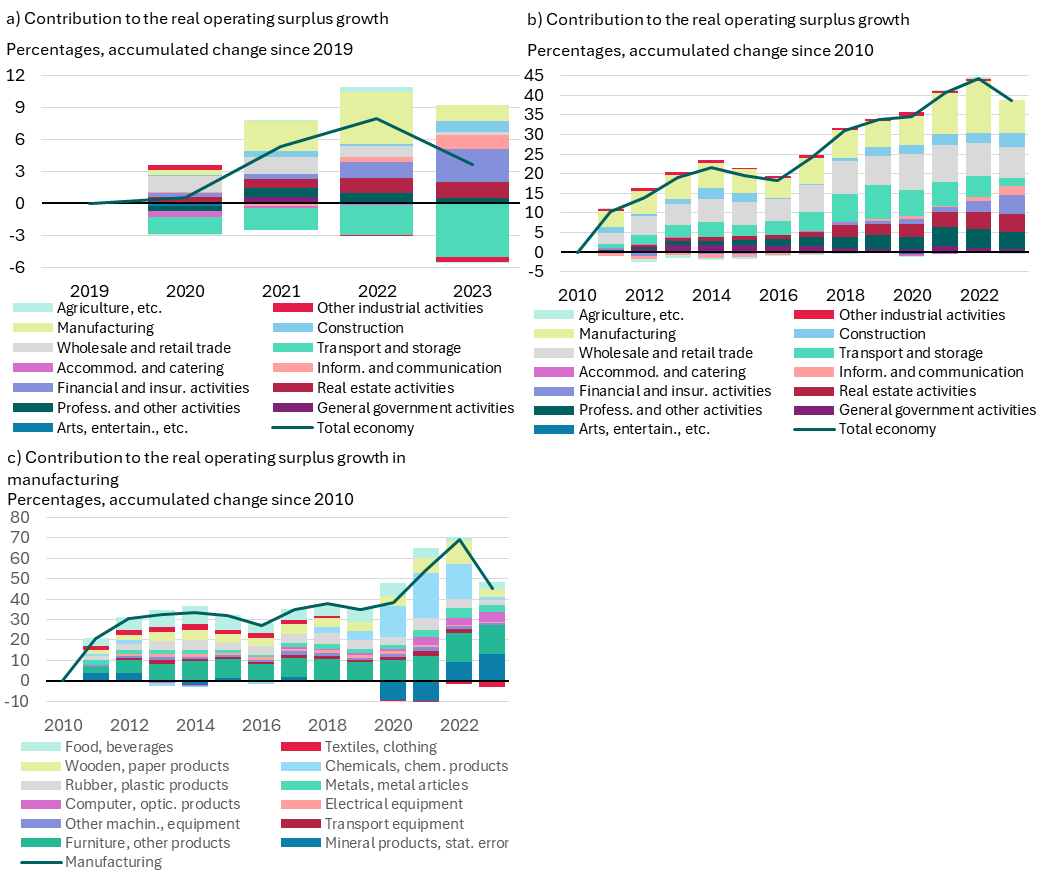
Lithuania’s operating surplus is mostly hampered by the economic activity of transport and storage (see Chart B, panel a). It has a specific dynamic. In the previous decade (2011–2019), transport and storage, which devoted a lot of resources to development in the EU, outpaced the growth of the Lithuanian economy. During this period, it accounted for around one-sixth of the total value added growth in Lithuania, and its share in Lithuania’s value added increased from 9.5% (2010) to 11.8% (2019). During the period under review, transport and storage accounted for more than a quarter of the total rise in Lithuania’s real operating surplus (see Chart B, panel b). In 2020, the development of this activity started to change significantly. With the economies of Europe and other countries facing various challenges and international trade developing at a slower pace, real sales revenue from transport and storage has almost stopped growing. In 2023, the latter was only 2.0% higher than in 2019. In addition to these factors, restrictions on freight transport from neighbouring non-EU countries contributed to this development of sales revenue. At the same time, real labour costs were growing. In 2023, they were 21.2% higher than in 2019 in the economic activity concerned. All this had a restrictive effect on the real operating surplus of transport and storage companies. It began declining in 2020 and fell annually up to and including 2023.
The downward trend of the operating surplus is, however, observed only in some economic activities.
Chart B. Contribution to the real operating surplus growth in Lithuania
Sources: State Data Agency and Lietuvos bankas calculations.
The development of the real operating surplus has also changed in manufacturing. Having increased until 2022, the real operating surplus in this economic activity has been declining in recent years (see Chart B, panel c). In 2023, it was 14.0% lower than in 2022 and only 7.7% higher than in 2019. The real operating surplus in manufacturing is mostly undermined by weaker performance in the production of chemicals and chemical products. This was likely exacerbated by the earlier significant rise in energy commodity prices and a decline in fertiliser production (at the start of russia’s large-scale military invasion of Ukraine), as well as the fall in the manufacture of products used to combat the global COVID-19 pandemic, which significantly boosted the real operating surplus of manufacturing as a whole in 2020–2022. Only a few industries of manufacturing show a continuing downward trend of the real operating surplus. It has been going on for quite some time, mainly in the manufacture of textiles, leather and leather products, and clothing (where the real operating surplus in 2023 was 50.1% lower than in 2019). On the other hand, there are manufacturing industries where the real operating surplus has been growing consistently and notably. For instance, it has been rising in the production of computer, electronic and optical products, where the real operating surplus in 2023 was 75.6% higher than in 2019.
In summary, it should be noted that the real operating surplus in Lithuania has been declining, but the downward trend has only been observed in some economic activities or their branches. The sluggish economic situation in European countries, slower growth of international trade, and fading positive impact of short-term factors have been contributing to this development of the operating surplus. Partly as a result, transport and storage activity is the main contributor to the decline of the real operating surplus in Lithuania. However, even with the deteriorating geopolitical situation and rising labour costs, the real operating surplus has increased in a relatively large proportion of economic activities. This is particularly the case for activities characterised by a strong use of innovation and advanced technologies such as production of computer, electronic and optical products, information and communication services.
3.Labour market
The Lithuanian labour market remained relatively favourable for employees in the first half of the year. Wages were growing at a somewhat fast pace, the unemployment rate was lower than a year earlier, and the extremely high stress indicator suggest that the labour market situation remains favourable for employees, with the number of permanent residents and people in employment also increasing over the year. These trends are unlikely to change significantly in the coming quarters, but there are also risks. The population growth slowed compared to last year, which has negative implications for the growth of employment and entire economy.
The population is at its highest level since 2016, but the growth rate has slowed down. The number of permanent residents in Lithuania was 2,894,000. This is the highest population number in almost a decade. Population growth was mainly driven by positive net migration, which offset the negative effects of natural change. However, population growth was slower: between January and August of this year, the number of permanent residents increased by a mere 0.1% year on year. This compares with a much higher growth of 0.9% last year. A significant drop in the number of foreigners holding a residence permit in Lithuania contributed to the slowdown in population growth. According to the latest data of the Migration Department, the number of foreigners holding a residence permit in Lithuania was 204,000 in August 2025, which is 14,000 less than last year. The sharpest decline was in the number of Belarusians holding a residence permit in Lithuania. The last time the number of foreigners living in Lithuania decreased was in 2016. This was compounded by the tightening of foreigner employment and residence permit rules in 2024, with restrictions on working with a visa or visa-free regime and the introduction of the quota mechanism providing that the quota of work permits in 2025 may not exceed 1.4% of the number of permanent residents of Lithuania. The quota for 2025 is 25,000 persons, down by 15,000 from a year ago.
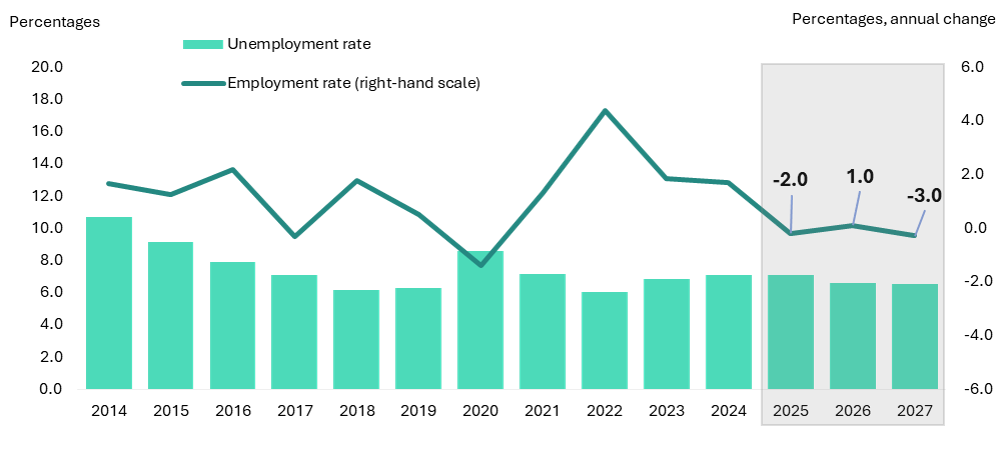
The slowdown in employment growth was mainly due to stricter rules on the employment of foreigners. In the first half of this year, total employment in Lithuania stood at 1,454,000, just 0.1% higher than a year earlier. This compares with the year-on-year increase of 2.3% in the first half of last year. Almost half of the employment growth was driven by foreigners last year. The slower employment growth can partly be attributed to the stricter employment and residence permit regime for foreigners, which is contributing to the shrinking number of foreigners doing unskilled jobs. According to the latest data of the Migration Department, the number of foreigners holding a residence permit was 98,000 in July of this year, down by 16% from last year. Employment developments were positively affected by higher employment of skilled professionals. The increase in the number of employed persons over the year was mainly due to the rise in employment in education, professional, scientific and technical, as well as information and communication industries. Lietuvos bankas projects that employment will contract by -0.2% this year and increase by 0.1% next year (see Chart 5).
Chart 5. Dynamics of the unemployment rate and the employed
Sources: State Data Agency and Lietuvos bankas calculations.
Note: Seasonally adjusted unemployment rate.
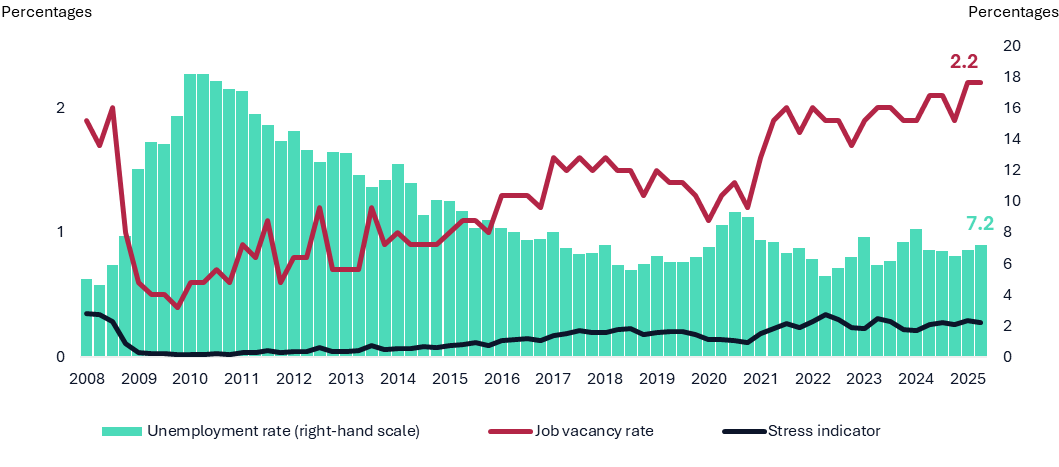
The unemployment rate in Lithuania is falling, but long-term unemployment remains high, reflecting structural problems in the labour market and a mismatch between employee skills and employer requirements. In the first quarter of this year, the unemployment rate was 7.1%, down by 0.5 percentage points year on year. The youth unemployment rate was 15.7%, down by mire 0.1 percentage points year on year. The downward trend of unemployment is also confirmed by the statistics on the registered unemployed: between January and July this year, the number of registered unemployed was 0.5% lower than a year ago. It should be mentioned that there were some negative trends as well. The long-term unemployment rate in the first half of this year was 0.5 percentage points higher than a year ago, while the long-term unemployed workers accounted for just over a third of all the unemployed. Long-term unemployment threatens their skills, reduces their competitiveness on the market, and increases the burden of social benefits on public finances. It is likely that the mismatch between the employer requirements and employee skills contributes to the particularly high long-term unemployment rate: although the unemployment rate fell over the year, the job vacancy rate rose to its highest level since records began (see Chart 6). It should be noted that one activity, i.e. transport and storage, contributed most to this increase. The Beveridge curve shows an outward shift, which means that there are vacancies available but the unemployed are not able to fill them. In a well-functioning labour market, the Beveridge curve reflects a negative relationship between unemployment and job vacancies: as unemployment falls, job vacancies increase, and vice versa. If this trend continues for a longer period of time, it would indicate a mismatch between the skills of employees and qualifications required by employers.
Chart 6. Unemployment and job vacancy rate and stress indicator
Sources: State Data Agency and Lietuvos bankas calculations.
Notes: Seasonally adjusted data. The level of labour market tightness is measured by the ratio of job vacancies to the unemployed.
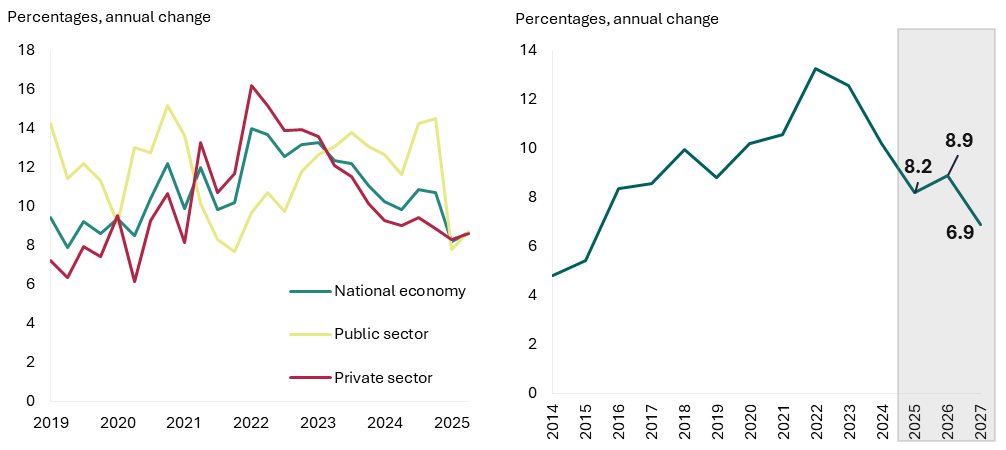
Wages continue to rise strongly, but at a slower pace than the average of the last five years. According to the data of the State Data Agency for the first half of the year, wage growth in the Lithuanian economy slowed down to 8.4% over the year. This compares with the annual wage growth of 10.0% in the first half of last year. It should be mentioned that this slowdown was partly due to particularly weak data for the first quarter, while the average wage growth in the second quarter was close to the average for 2019–2024. The slowdown in the first quarter was mainly driven by slower wage growth in the public sector, which stood at 7.8% and was lower than in the private sector for the first time in almost two years. By comparison, the annual wage growth in the public sector was as high as 14.5% in the fourth quarter of last year. However, this strong growth of wages in the public sector in the fourth quarter of last year could be attributed to the exceptionally high bonuses in the education sector, which were just over a quarter higher than a year ago. Wages of the education sector employees are set to increase further. As of September this year, the salary coefficients of teachers and education support staff will rise by 8% and are planned to grow annually by 5 percentage points faster than the projected increase of the national average wage until 2028. However, the impact of these increases on wage growth will be limited in the third quarter due to the very high base effect: in September 2024, salaries of education employees rose by as much as 15.5%. Overall, the still rapid wage growth can be attributed to the very tight labour market situation. The supply of workers with the necessary qualifications continues to lag behind demand, which allows workers to maintain strong bargaining power. Lietuvos bankas projects that wages will rise by 8.2% this year and accelerate to 8.9% next year (see Chart 7).
Chart 7. Annual wage developments by sector (left-hand panel) and projection (right-hand panel)
Sources: State Data Agency and Lietuvos bankas calculations.
Note: National economy and private sector excluding sole proprietorships.
Prepared by Kasparas Vasiliauskas
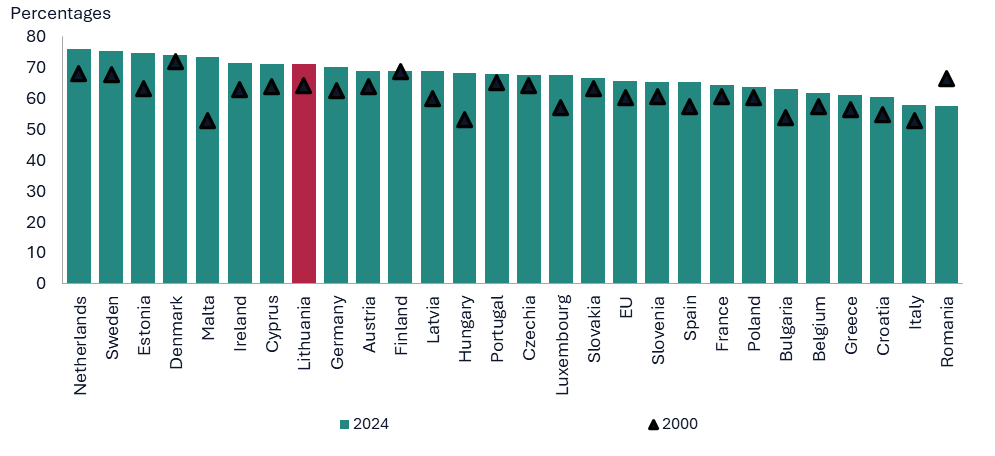
Chart A. Development of labour force participation of people aged 15–74 in EU countries
Sources: Eurostat and Lietuvos bankas calculations.
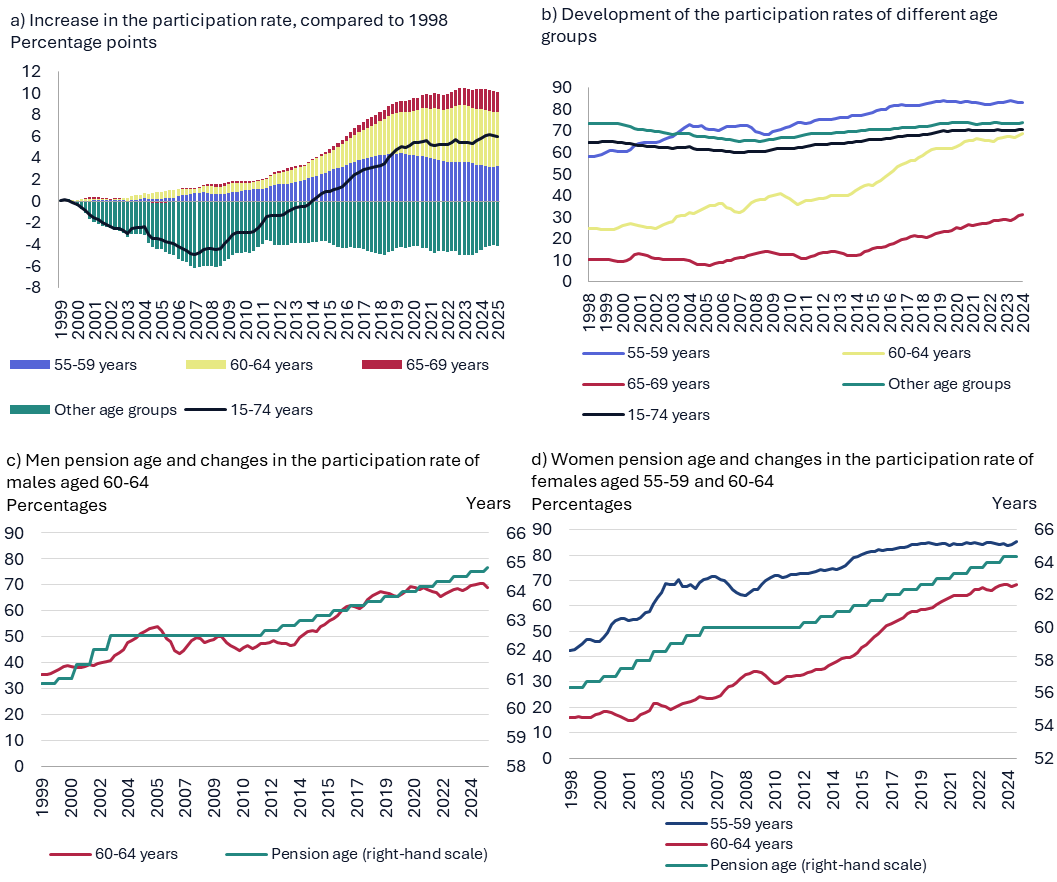
A more detailed analysis of the labour force participation of the population aged 15–74 shows that the most marked increase was among older age groups (55–59, 60–64, and 65–69 years), whose participation in the labour market grew most rapidly (see Chart B, panel a). The participation rate of all these groups more than doubled, while that of the 60–64 age group even tripled (see Chart B, panel b).
The main factor behind the rise in participation among older people was the gradual extension of the retirement age, which was implemented in several stages. In the first stage (1995–2001), it was planned to extend the retirement age for women from 55 by 4 months per year and for men from 60 by 2 months per year. In the second stage (2001–2006), it was planned to increase the retirement age for both genders by 6 months per year until it reached 62 for women and 62.5 for men. The target age for men was reached in July 2003 and for women in July 2006. The third stage (2012–2026) provides for extending the retirement age for women by four months per year and for men by two months per year until the retirement age for both genders reaches 65 in 2026.
These stages had different effects on different age groups. For instance, the first two stages had the greatest impact on men and women aged 60–64 and women aged 55–59. During the third stage, participation of both men and women aged 60–64 rose rapidly (see Chart B, bottom panels).
The increase in the labour force participation rates since the beginning of the 21st century can be attributed to the extension of the retirement age.
Sources: Eurostat, State Social Insurance Fund and Lietuvos bankas calculations.
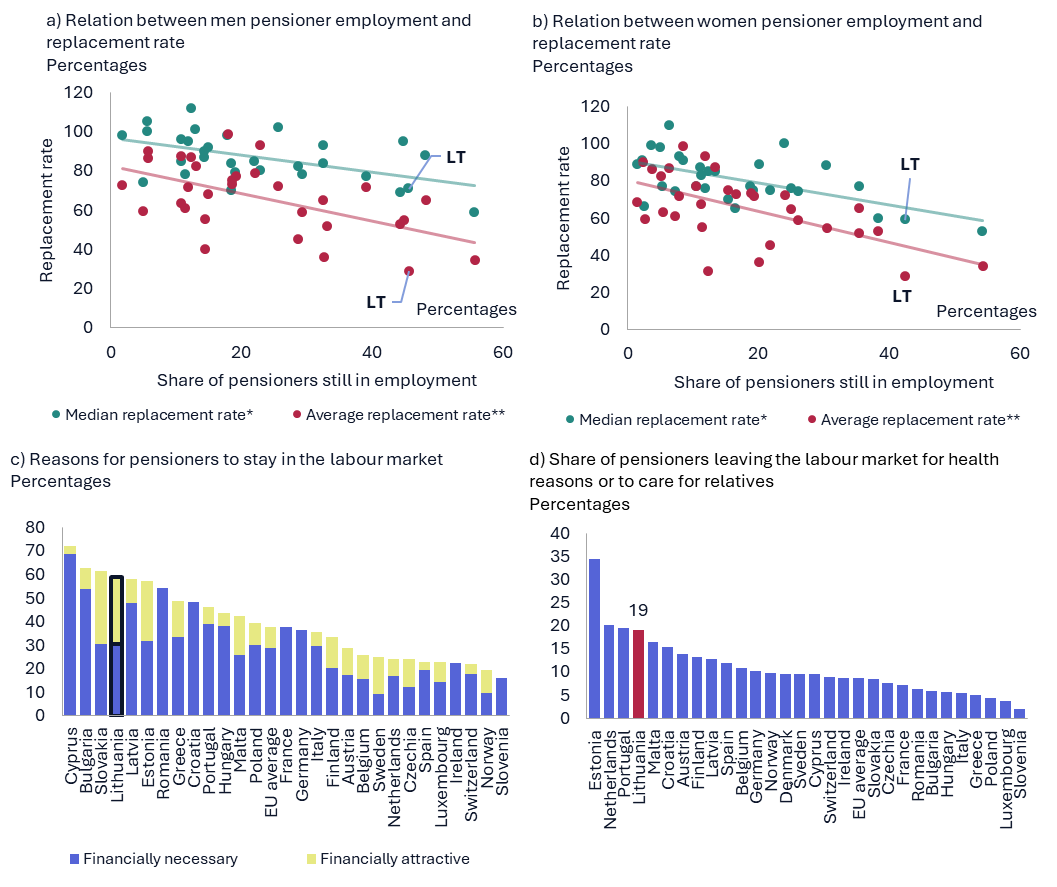
The high participation rate of pensioners can mainly be attributed to the relatively low replacement rate.
Chart C. Reasons for high labour market participation rates among pensioners
Sources: OECD, Eurostat and Lietuvos bankas calculations.
* The median replacement rate is defined as the ratio of the median equivalent disposable income of persons aged 65 and over to that of persons aged under 65.
** The average replacement rate is defined as the ratio of average net pension income to average wages.
In summary, it can be said that in recent decades, the growth of labour force participation in Lithuania has been mainly driven by an increase in the participation of older people in the labour market because of the gradual extension of the retirement age, low replacement rate, and widespread social poverty among seniors. Although there is currently no information in the public domain that would indicate a further extension of the retirement age, the experience of other countries, including Lithuania, shows that with increasing life expectancy and pressure on the pension system, the retirement age is gradually being raised. There are also no objective reasons to consider that the replacement rate will increase significantly in the future. All these factors suggest that the labour force participation rate may increase further. However, this potential is based mainly on structural and social reasons rather than the favourable ones, i.e. the financial need for older people to remain in the labour market for longer. In order to achieve sustainable growth of social well-being, the long-term path should be that older people’s participation is not only driven by material circumstances but also by the opportunity to fulfil their social, self-expression, and community needs. In this case, a broad participation of the older population in the labour market would contribute both to economic performance and to the wider well-being of society.
Prepared by Jose Garcia-Louzao
Wages play a central role in the decisions of households and firms alike. For households, wages shape decisions about consumption and savings. For firms, wages are a key input cost that influences prices, especially when growth outpaces productivity. Wages reflect and shape macroeconomic conditions, rising in tighter labour markets and interacting with inflation through cost-push effects and expectations. Therefore, in today’s complex economic environment, understanding the drivers of wage growth is essential for central banks.
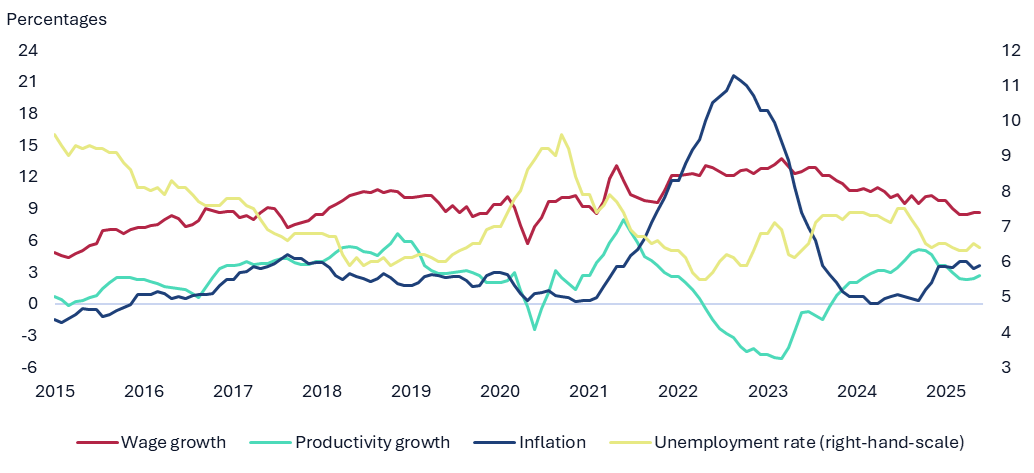
Between 2015 and 2025, nominal wages in Lithuania rose at an average annual rate of around 9.5%, but their relationship to inflation, productivity, and labour market conditions shifted significantly (Chart A). Early years saw slower wage growth amid high unemployment, low inflation, and weak productivity. From 2017, stronger labour markets and productivity gains supported wage growth of close to 10%, alongside moderate inflation. The 2020 pandemic temporarily reduced both wages and productivity, but they both rebounded despite rising unemployment. From 2021, inflation surged above 20%, outpacing productivity and eroding real wages. By 2023, monetary tightening helped bring inflation down, productivity started to recover, and real wages started to catch up. Unemployment remained elevated and has only recently begun to trend downward, still staying above pre-pandemic levels.
From 2015 to 2025, nominal wage growth in Lithuania averaged around 9.5% annually, but its alignment with inflation, productivity, and labour market conditions fluctuated markedly over time, reflecting changing economic conditions.
Chart A. Wage growth and key macroeconomic variables
Source: State Data Agency, State Social Insurance Fund and author’s calculations.
Notes: “Wage growth” refers to year-on-year monthly log changes in earnings. “Labour productivity” refers to year-on-year quarterly valued added per worker log changes. “Inflation” refers to year-on-year monthly consumer price index log changes. “Unemployment” refers to the monthly unemployment rate. All variables are given in percentages.
Cyclical and structural developments in Lithuania have influenced the relative importance of key wage drivers such as inflation expectations, productivity gains, and labour market tightness. To better understand the contribution of these variables, this box estimates a reduced-form wage Phillips curve and decomposes annual nominal wage growth over the last decade. The wage Phillips curve provides a parsimonious and empirically tractable framework for attributing nominal wage growth to labour market conditions, inflation, productivity dynamics, and a residual component. This residual captures the portion of wage growth not explained by the main drivers and may reflect other factors such as institutional changes, sectoral shifts, or measurement issues.
The three core variables in the model account for 79% of the variation in monthly nominal wage growth in Lithuania from 2015 to 2025, capturing most of the observed dynamics over the period. The estimated semi-elasticity with respect to unemployment is substantial: a one-percentage-point increase in the unemployment rate is associated with a 0.58 percentage-point decrease in annual nominal wage growth. The estimates also show a partial pass-through from real productivity to wages: a one-percentage-point rise in productivity raises wages by 0.30 percentage points. Similarly, a one-percentage-point uptick in consumer price inflation raises annual nominal wage growth by 0.31 percentage points.
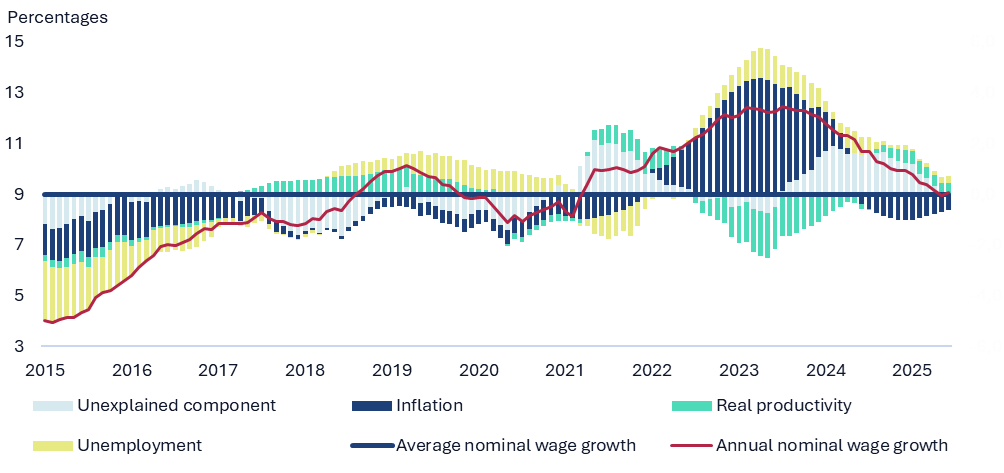
Nominal wage growth can be expressed as the sum of contributions from each driver using the wage Phillips curve estimates. Chart B illustrates the outcomes of this decomposition, expressing wage growth and its drivers as deviations from the sample period average. The results highlight how the relevance of each driver to nominal wage growth in Lithuania evolved between 2015 and 2025.
Nominal wage growth shifted from being shaped by labour market slack and structural factors to being largely driven by the inflation surge and its lagged effects, before normalising as inflation subsided.
Chart B. Wage Phillips curve wage growth decomposition
Source: State Data Agency, State Social Insurance Fund and author’s calculations.
Notes: The data sample covers the period from July 2013 to May 2025. The wage Phillips curve model regresses year-on-year nominal monthly earnings growth on year-on-year real productivity growth, twelve-month lagged unemployment rate (labour market indicator), and the average of the past 12 months of year-on-year monthly inflation. “Wage growth” refers to year-on-year monthly earnings changes, 12-month moving averages. “Labor productivity” refers to year-on-year quarterly valued added per worker, 4-quarter moving average. “Inflation” refers to year-on-year monthly consumer price index changes. “Unemployment” refers to the monthly unemployment rate. Wage growth and variable contributions are expressed as deviations from the model-implied mean in the first quarter of the estimation sample covering January 2015 to May 2025. Contributions are computed as in Yellen (2015).
At the beginning of the period (2015–2017), nominal wage growth was below average, primarily due to relatively bad labour market conditions. The low-inflation environment also restrained nominal wage increases. From 2017 onwards, improving economic conditions and stronger productivity gains pushed up wages. Inflation contributed little to this rise, despite exceeding the 2% target until 2020. Throughout 2015–2020, the unexplained component remained substantial, likely reflecting structural, institutional, or sector-specific factors not captured by the Phillips curve. Examples of such factors include euro area accession in 2015 and labour market reforms in 2017. Overall, these factors negatively affected wage growth during this initial period.
From 2020 to 2025, nominal wage growth was highly volatile, accompanied by shifts in the underlying drivers. The economic downturn induced by the COVID-19 pandemic suppressed nominal wage growth between 2020 and 2021 as economic activity and productivity fell. From 2021 onwards, wages rose sharply, peaking in 2023. Although improving labour market conditions supported growth, the surge in inflation, which exceeded 20% at its peak, became the dominant driver. This reflects the backward-looking responsiveness of wages to past price increases. This contrasts with the period from 2017 to 2019, when modestly above-target inflation played only a minor role. Starting in July 2022, the tightening of the monetary policy brought inflation close to the 2% target by late 2023. Consequently, the contribution of inflation to wage growth declined sharply, turning negative in 2024. During this period of disinflation, the unexplained component grew in importance, likely due to structural or institutional factors, as well as the limits of the Phillips curve in capturing real wage catch-up. Throughout the period, sluggish productivity growth tempered upward pressures from inflation and tight labour markets. The most recent data indicate a normalisation of wage dynamics, with the model’s core variables again explaining most of the variation.
4.External sector
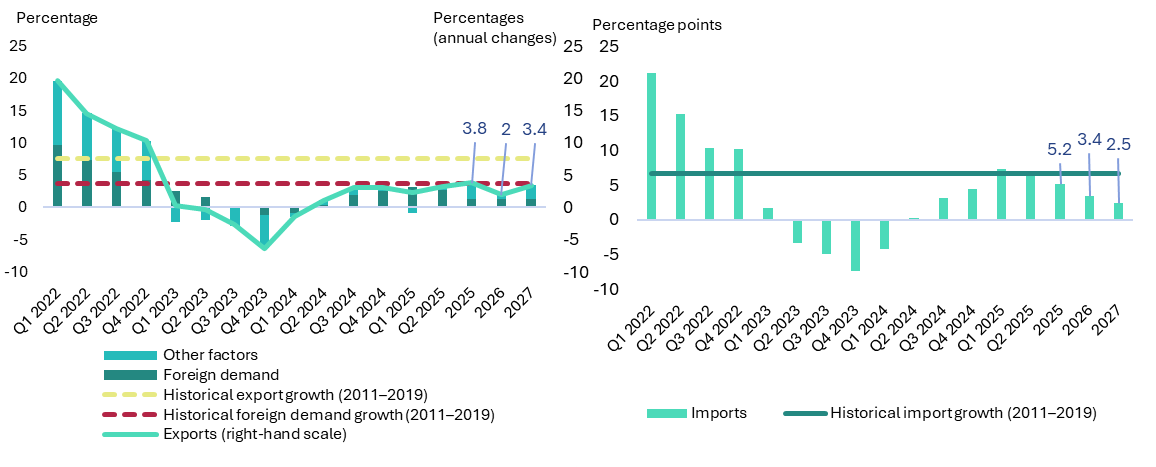
In the first half of 2025, net exports declined as imports outpaced exports. The growth of imports was mainly driven by a recovery in investment in machinery and equipment and the rebuilding and accumulation of stocks in anticipation of tariff changes. As a result of these factors, import growth exceeded the average rate of the past decade (see Chart 8, right-hand panel). Exports increased by 2.4% in the first quarter, mainly due to rising foreign demand, but their growth was significantly slower than in the previous decade (see Chart 8, right-hand panel). Exports are projected to maintain a positive growth trend in the final months of 2025 and in 2026–2027, increasing by an average of 3.1%, while imports are also expected to grow faster, by around 3.7%. Export growth will be driven mainly by external demand, while import growth will be driven by strong domestic demand. Due to faster import growth, the contribution of net exports to GDP will be less favourable than before, as current developments show.
Exports and imports are projected to grow steadily next year, but a faster import growth will continue to reduce net exports.
Chart 8. Historical development and projections of real exports of goods and services (left-hand panel) and imports (right-hand panel) (2-quarter moving averages)
Sources: State Data Agency, ECB, Lietuvos bankas and Lietuvos bankas calculations.
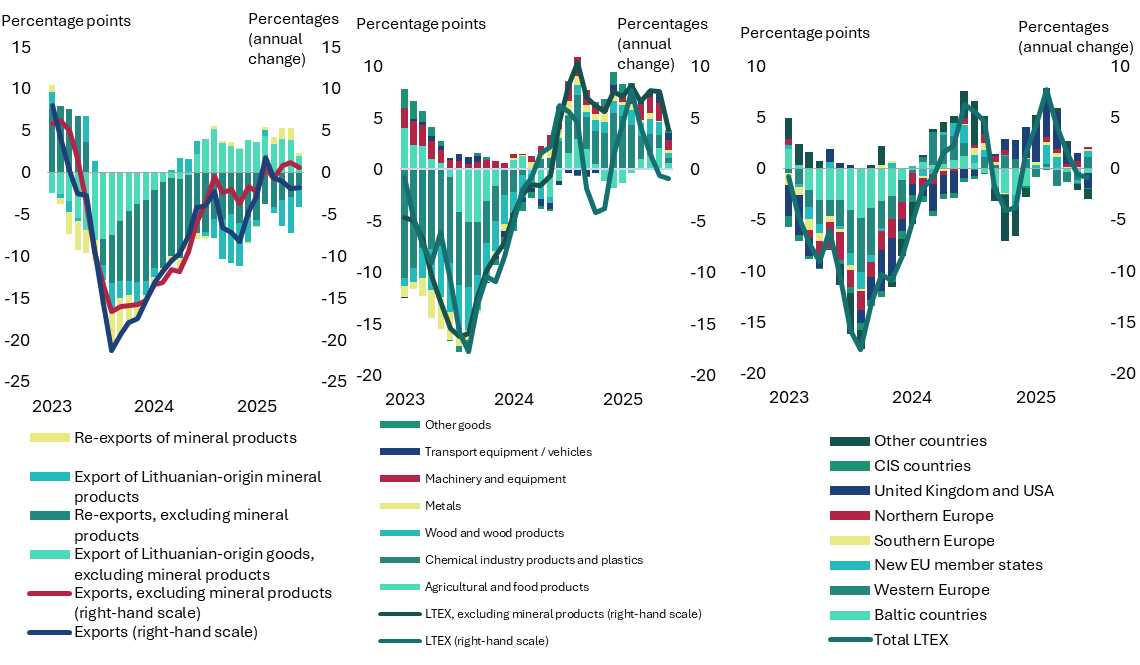
The annual development of exports of goods of Lithuanian origin, excluding mineral products, showed an average monthly growth of 3.8% in the first half of this year, mainly due to higher exports volumes to the US driven by the risk of tariffs. In contrast, exports of mineral products of Lithuanian origin(-1.85%) and re-exports excluding mineral products (-4.1%) contracted. In the first half of 2025, apart from the growth of mineral products, the main drivers of Lithuanian exports were the means of transport such as ships and boats, machinery and equipment, wood, chemical products and plastics, as well as agricultural and food products (see Chart 9, central panel). Geographically, exports grew most strongly to the US and the UK. This was affected by trade uncertainty and tariffs planned by the US, which led Lithuanian companies to increase their exports before tariffs came into force. Meanwhile, exports to CIS countries, excluding mineral products, continued to decline, primarily due to a consistent decline in exports to Belarus and Kyrgyzstan, driven by sanctions and weakening economies of those countries (see Chart 9, right-hand panel). Re-exports are slowly recovering; although the annual change (3-month moving average) is still negative, the decline is moderating. In the first half of the year, re-export flows to the Baltic countries, especially of mineral products, gradually increased.
Exports of Lithuanian origin grew in the first half of the year, mainly due to stronger demand on Western markets, especially the US, while trade with CIS countries continued to decline owing to sanctions and slower-growing economies. Re-exports continued to contract, but the decline moderated, while flows of mineral products to the Baltic countries increased.
Chart 9. Annual development of exports of goods (3-month moving average) (left-hand panel), annual development of exports of Lithuanian origin (3-month moving average) (central panel), and annual growth of exports of Lithuanian origin by region (3-month moving average) (right-hand panel)
Sources: State Data Agency and Lietuvos bankas calculations.
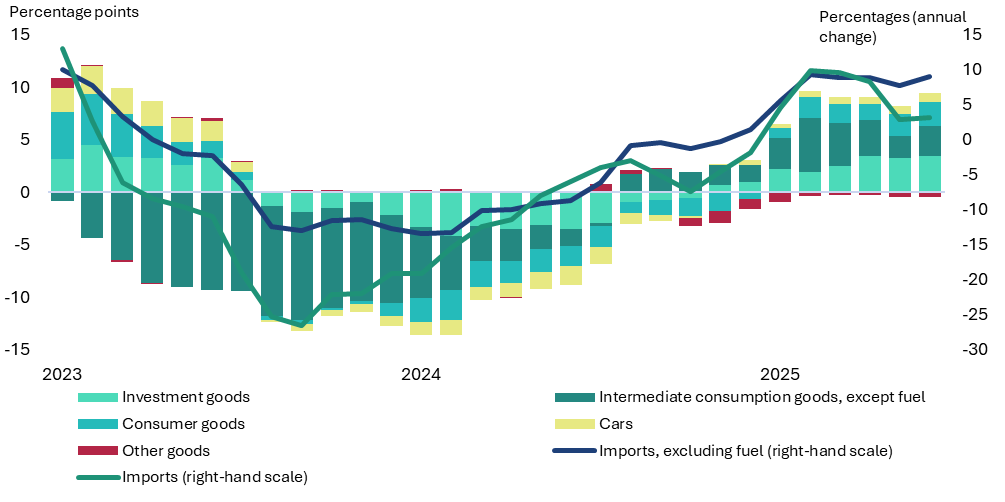
In the first half of 2025, import growth was mainly driven by recovering investment, especially in machinery and equipment. This was supported by EU-backed projects and falling interest rates, which have facilitated business investment. While imports of investment, intermediate goods (excluding fuels), and consumer goods increased in the first half of 2025, the growth of fuel imports slowed down considerably. This was not only due to the fall in international oil prices, which depressed the nominal value of imports, but also to domestic factors such as higher excise duties and a substantial drop in retail fuel sales.
In the first half of 2025, imports of most product groups grew, driven by recovering investment and more favourable financing conditions. The only exception was fuel imports, which declined on the back of cheaper oil, changes in excise duties, and falling retail sales.
Chart 10. Annual growth of imports (3-month moving average)
Sources: State Data Agency and Lietuvos bankas calculations.
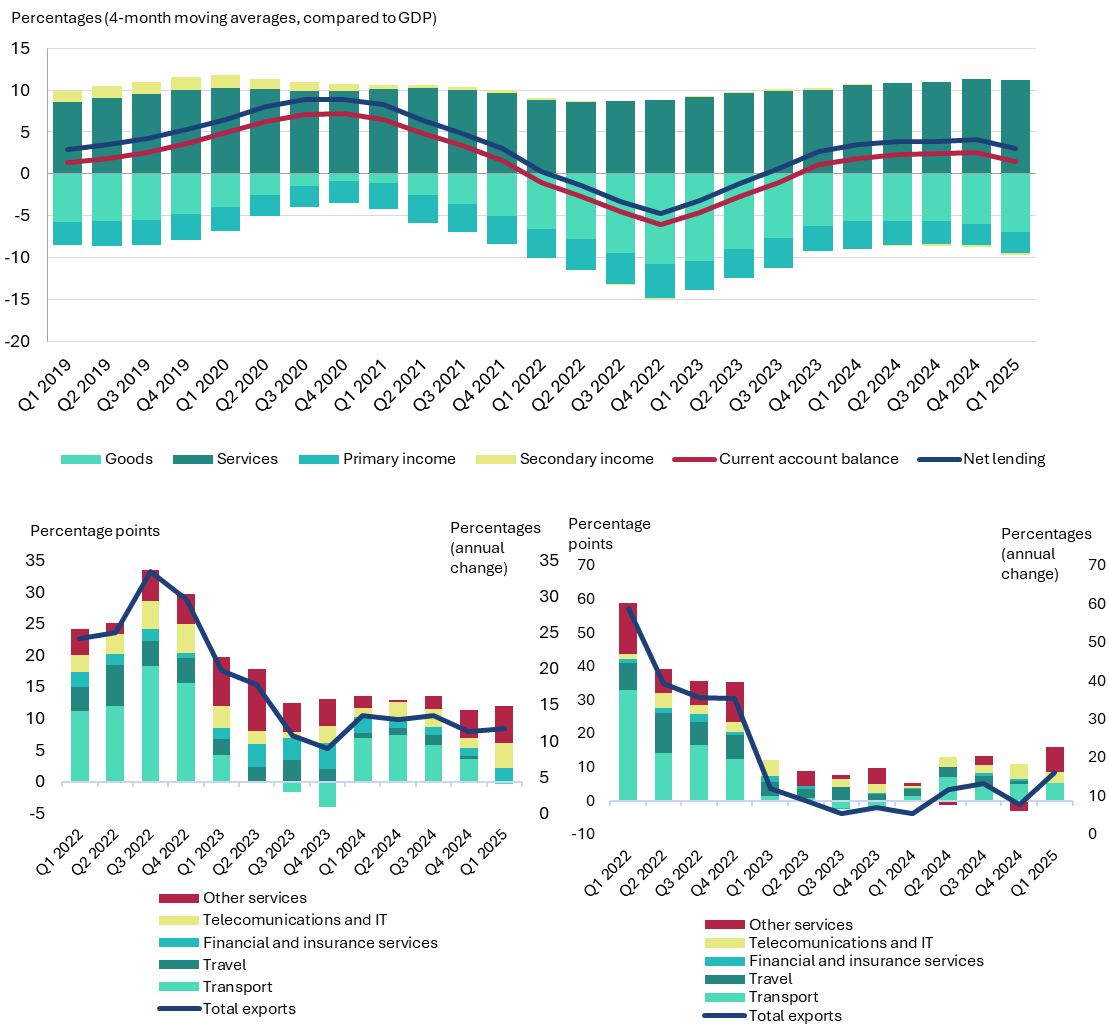
The balance of payments data show a marginal decline of the current account balance in the first quarter of 2025. This was mainly due to the rise in the product deficit to almost 3% of GDP, driven by imports growing significantly faster than exports and a small but gradually widening secondary income deficit. The trade balance of services remained unchanged and stable, accounting for 11.2% of GDP (based on a 4-quarter moving average). The stability of the balance was driven by opposing trends: exports of telecommunication and IT services continued to grow strongly, but transport services underperformed, partly due to the falling European road transport tariffs. At the same time, imports of services also increased, mainly due to higher demand for transport and IT services. As a result of these opposing movements, the overall balance of services indicator did not change significantly. In Lithuania, there is a noticeable trend that services exports exceed imports, whereas the opposite is true for goods. This implies that the services sector is gaining importance and partly offsets the deficit of goods exports. Transport services account for the largest share of services exports (around €1.2 billion in the first quarter of 2025). Around 73.3% of services exports go to the EU, with Germany remaining the largest market where consistent demand for transport services supports export volumes. At the same time, high value-added services such as information and communication technologies are playing an increasingly important role in expanding export volumes and strengthening the positive services balance.
The current account surplus narrowed as the goods deficit grew faster than the services surplus. Nevertheless, the services sector remains vital in helping to mitigate the goods trade imbalance.
Chart 11. Current account components and net borrowing (4-quarter moving averages compared to GDP), annual change in exports of services (bottom left-hand panel), and annual change in imports of services (bottom right-hand panel)
Sources: State Data Agency, Lietuvos bankas and Lietuvos bankas calculations.
Prepared by Kasparas Vasiliauskas
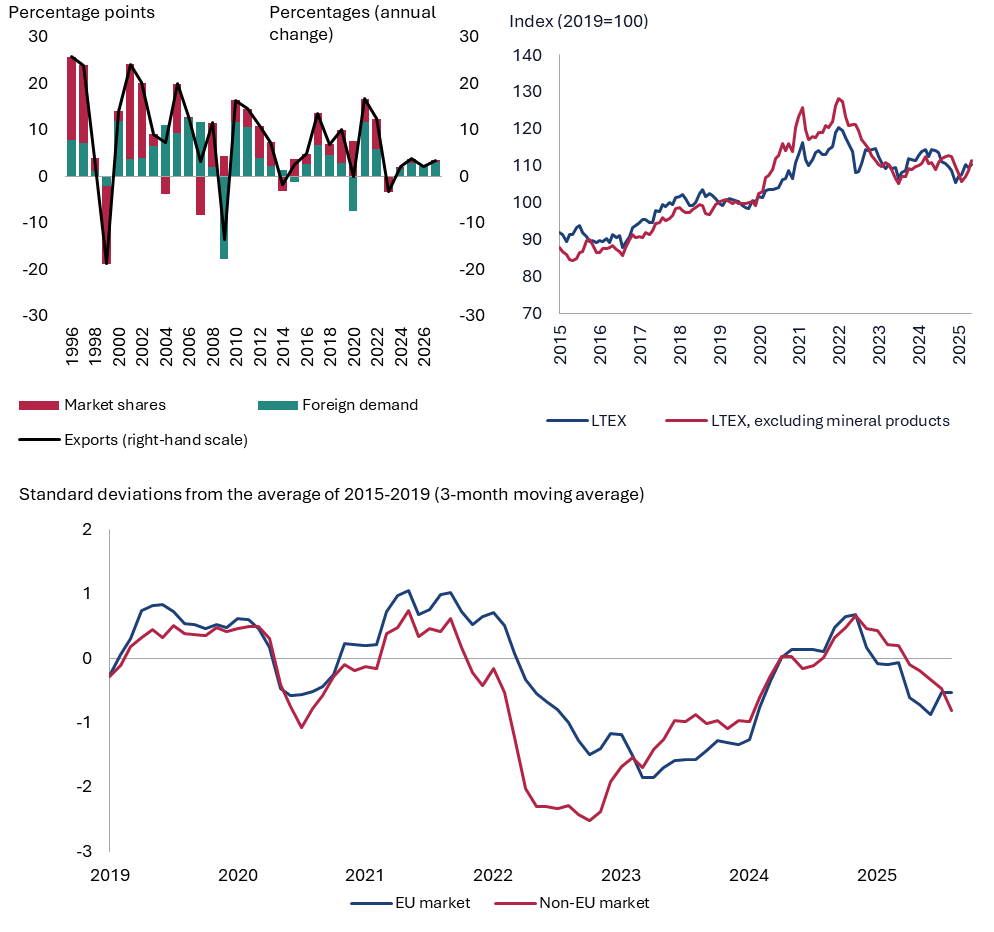
However, in recent years market shares have grown more modestly than has been typical for Lithuania historically, while the projected growth is also diverging from previous trends. It is likely to be mainly driven by the development of services exports. While objective data do not yet indicate that Lithuanian producers of goods are facing grave difficulties (see Chart A, top right-hand panel), subjective assessments of Lithuanian companies of their ability to compete on international markets have deteriorated markedly (see Chart A, bottom panel).
One of the reasons for the deterioration in expectations may be the US tariffs for trading partners. These tariffs restrict foreign exporters’ access to the US market and at the same time may negatively affect the competitiveness of Lithuanian exports in Europe. Restricting China’s access to the US market creates the risk that Chinese producers will try to divert surplus production to Europe. Data for the first half of 2025 indicate that Chinese exports to Europe were one tenth higher than a year earlier. This raises the question: what are the risks to Lithuanian exporters from the increasing penetration of the European market by Chinese exporters? To answer this question, the box analyses to what extent Lithuanian exporters have historically been exposed to competition from Chinese exporters and which product groups are most at risk on the EU market.
Chart A. Development, projections and contributions of Lithuanian exports of goods and services (top left-hand panel), development of market shares of exports of Lithuanian origin (top right-hand panel), and assessment of companies of their ability to compete (bottom panel)
Sources: Eurostat, U.S. Census Bureau, HM Revenue & Customs, State Data Agency and Lietuvos bankas calculations.
Note: LTEX – exports of Lithuanian origin.
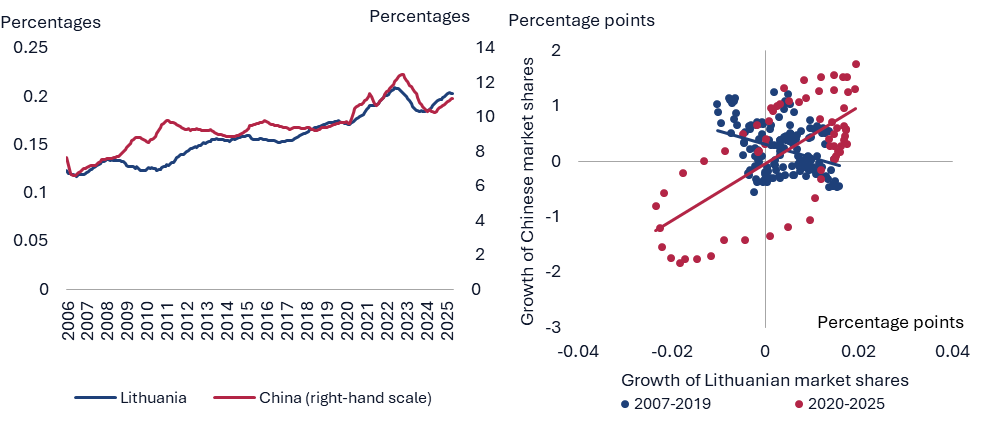
Over the last 20 years, both Lithuanian and Chinese exporters have significantly increased their market shares in the EU (see Chart B, left-hand panel). However, the development of market shares varied from period to period. Before the COVID-19 pandemic, Lithuania’s market share growth coincided with China’s decline and vice versa. From the start of the pandemic until the beginning of the second quarter of 2025, the market shares of both countries grew simultaneously (see Chart B, right-hand panel).
Sources: Eurostat, State Data Agency and Lietuvos bankas calculations.
Note: Data for 2025 are available up to and including May.
Prior to the COVID-19 pandemic, the relatively slower development of Lithuania’s export market shares in the EU could be attributed to a deterioration in price competitiveness vis-à-vis Chinese exports.
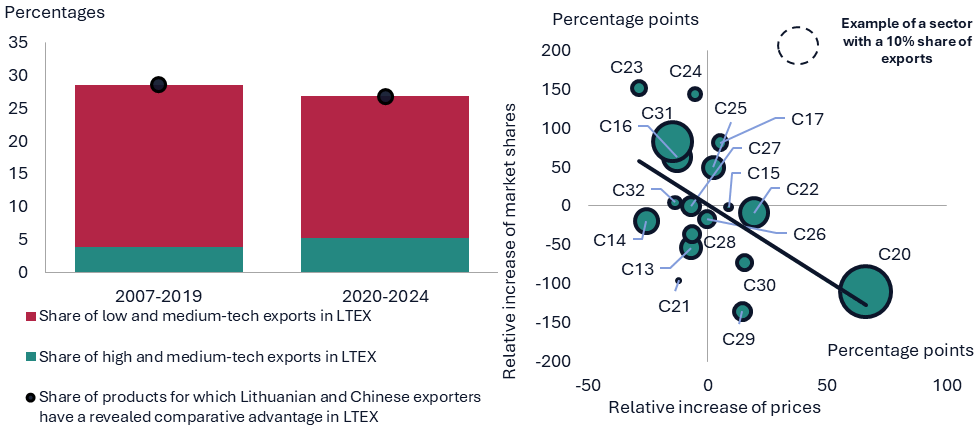
Sources: Eurostat, National Bureau of Statistics of China, State Data Agency and Lietuvos bankas calculations.
Notes: C codes represent the following sectors under NACE Rev. 2: C13 – manufacture of textiles; C14 – manufacture of wearing apparel; C15 – manufacture of leather and related products; C16 – manufacture of wood and of products of wood and cork, except furniture; C17 – manufacture of paper and paper products; C20 – manufacture of chemicals and chemical products; C21 – manufacture of basic pharmaceutical products and pharmaceutical preparations; C22 – manufacture of rubber and plastic products; C23 – manufacture of other non-metallic mineral products; C24 – manufacture of basic metals; C25 – manufacture of fabricated metal products, except machinery and equipment; C26 – manufacture of computer, electronic and optical products; C27 – manufacture of electrical equipment; C28 – manufacture of machinery and equipment n.e.c.; C29 – manufacture of motor vehicles, trailers and semi-trailers; C30 – manufacture of other transport equipment; C31 – manufacture of furniture and C32 – other manufacturing. LTEX – exports of Lithuanian origin.
Examining from a different perspective the goods that have contributed most to Lithuania’s market share gains in the EU most since 2020, it is evident that in recent years significant market share increases have been driven by exports of higher value-added products that are subject to higher US tariffs (see Chart D, central panel). Historically, in this product segment the relationship of price competition with China was relatively weak and, on the contrary, Lithuanian exporters were able to raise market shares by manufacturing relatively more expensive products (see Chart D, right-hand panel). This gives hope that, as the pressure from Chinese exports builds up, at least some of the pressure on higher value-added producers could be outweighed by non-price competitiveness factors such as higher product quality, strong trade ties, and geographical proximity to the EU market. On the other hand, in other product segments, such as medium and low-tech and those where price competitiveness is more important, the risk of competitive pressure from Chinese exports is much higher.
From the start of the COVID-19 pandemic to the present, higher value-added goods have been the main contributors to the growth of Lithuania’s export market share in the EU. Historically, the link between price competitiveness vis-à-vis Chinese exporters and market share growth has been weak in this product group.
Chart D. Increase in Lithuanian and Chinese export market share in the EU by sector (left-hand panel) and by technology intensity in May 2025 compared to the end of 2019 (12-month moving averages) (central panel), as well as the relative annual growth of prices and market shares between 2015 and May 2025 (12-month moving averages) (right-hand panel)
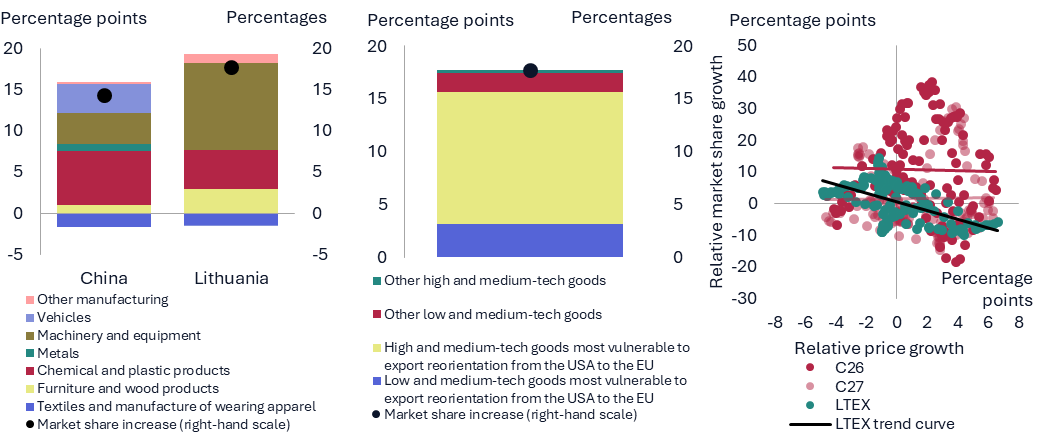
Sources: Eurostat, National Bureau of Statistics of China, State Data Agency and Lietuvos bankas calculations.
In summary, it should be noted that Lithuanian exporters have successfully developed their market shares since the beginning of the COVID-19 pandemic, taking advantage of supply chain disruptions, changes in demand, and new product development. However, future prospects are becoming more dependent on competition with China. In the segments that have contributed most to market share growth in recent years, the competitive advantage is provided by product quality, innovation, specialised niches, and proximity to the EU market rather than by price factors. This suggests that even increased Chinese pressure in these areas could be partially offset. The risks are much higher in the medium and low-tech segments, where price competition is the key factor: China’s diversion of surplus production to Europe could exacerbate price pressures and limit Lithuania’s export growth opportunities. Therefore, the long-term development of market shares will mainly depend on the ability to sustain a structural shift towards higher value-added production and systematic investment in innovation to reduce vulnerability in the environment of price competition.
5.Prices
Since the beginning of the year, higher food prices and continued increases in prices of services have been the main drivers of accelerating inflation. While prices of services have remained the most important component of headline inflation for several years now, their importance was matched by food in 2025, with its rising prices becoming the second most important factor contributing almost as significantly to the growth trends (see Chart 12, left-hand panel). These components accounted for almost all of the HICP growth. Meanwhile, the rise in energy prices has stopped and has been exerting a moderate negative impact on inflation since May. Core inflation picked up to 3.3% in January but declined marginally over the year to 3.1% in July. Food prices are projected to accelerate in the second half of the year, with average annual inflation of 3.5 in 2025 and wage increases of around 8%, while domestic demand will remain robust. Market expectations point to lower fossil fuel prices in 2026 compared to this year and a noticeably stronger euro. Tax changes will also contribute to rising prices, particularly due to the removal of VAT relief on heating and firewood. Given these and other macroeconomic assumptions, average annual inflation is projected at 3.1% in 2026 before easing to 2.6% in 2027 (see Chart 12, right-hand panel).
In 2025, average annual inflation has outpaced core inflation and will exceed 3%.
Chart 12. HICP inflation and its contributions (left-hand panel), and projections of price dynamics (right-hand panel)
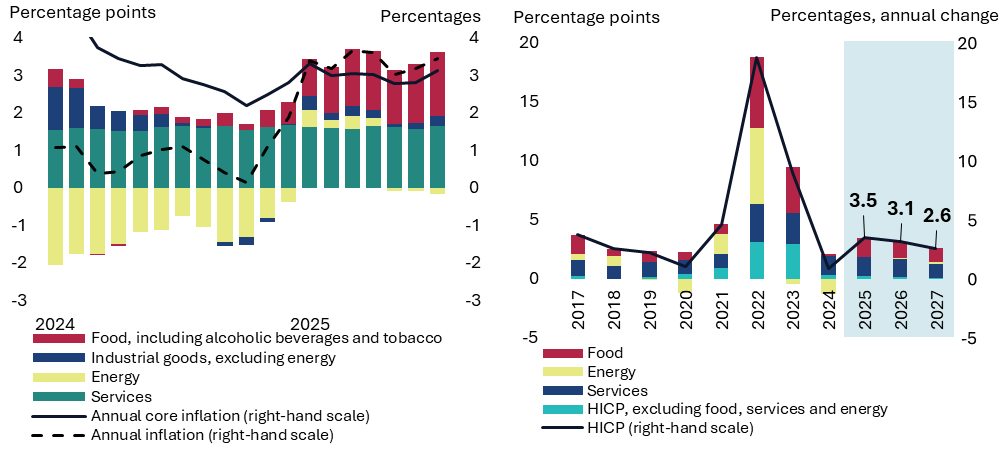
Sources: State Data Agency and Lietuvos bankas calculations.
Food prices are already above last year’s levels, towing to higher prices of raw material purchases and agricultural products. The fading of the downward effect of unprocessed food prices and rising prices of processed food have contributed significantly to elevated annual inflation. While prices of essential food groups such as bread and cereal products, dairy products, other foodstuffs and vegetables were declining in 2024, the trend has been reversed this year, with prices rising for all these categories. In addition, prices for other food groups have also increased at a faster pace. While the last quarter of the previous year saw a sharp rise in the farm gate prices of food commodities, this year the dynamics of consumer food prices have decoupled from producer food prices which have remained at a similar level. The main contributors to food inflation were higher prices of other products, alcoholic beverages, dairy and meat products, as well as tobacco (see Chart 13, left-hand panel). The impact was partially programmed due to the changes in excise duties that entered into force in January. This summer, due to unfavourable weather conditions and poor harvests, prices of fresh fruit and vegetables not only remained stable but some even rose (an unusual dynamic for the summer season). Given the greater threat of extreme weather and the effects of climate change, the impact of these risks on the productivity of the agricultural sector and the likelihood of poor harvests is likely to increase further in the future.
The increase in heating costs during the cold season was the key contributor to the overall dynamics of energy prices and will continue to be the main driver of price rises in this segment in the short term. The higher impact of solid fuel and heating prices contributed significantly to the growth of annual energy inflation (see Chart 13, right-hand panel). Fuel and lubricant prices, which rose in January on the back of excise duty changes, subsequently declined over the year. This was affected by both the boost in global oil production and the marked appreciation of the euro against the US dollar since March. Heating prices are expected to continue rising in the upcoming cold season, mainly due to the abolition of the VAT exemption for heating from 2026, with the rate increasing from 9% to 21%. At the same time, electricity prices continue to fall, mainly due to the uptick in domestic renewable energy production. This effect is particularly pronounced when natural conditions are favourable for electricity production: when the sun is shining and the wind is strong, thermal power plants operate at higher capacity. Electricity prices reached a five-year low in June this year. In 2025, Lithuania will have the smallest commercial imbalance of the electricity system since the closure of the Ignalina nuclear power plant, but it will need to continue to rapidly expand its renewable energy generation capacity to fully meet consumer demand.
Food prices are rising faster, while the downward effect of energy prices has faded.
Chart 13. Impact of food prices (left-hand panel) and energy prices (right-hand panel) on annual headline inflation
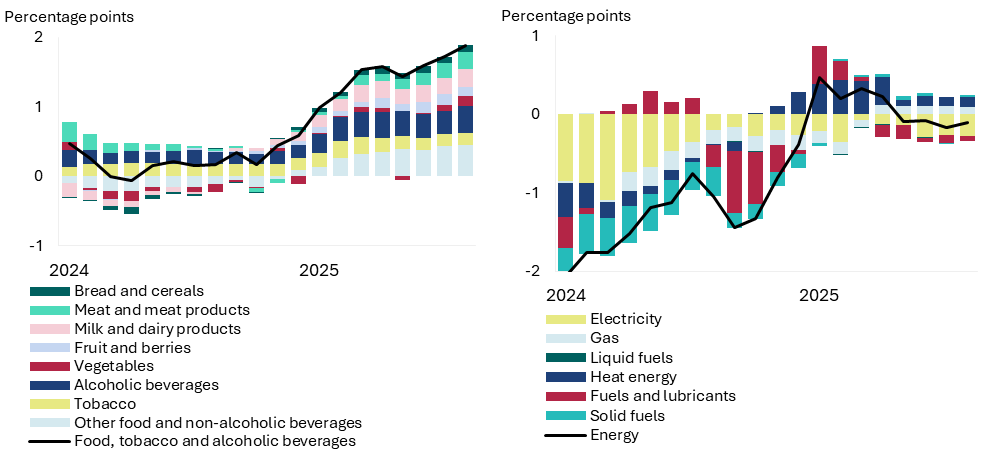
Sources: State Data Agency and Lietuvos bankas calculations.
Prices of services continue to rise at an annual rate of almost 6%. This reflects some pricing inertia in most segments of the services sector, driven by rising wage costs and increasing operating costs. This component will continue to be one of the main drivers of inflation in the coming years as well (see Chart 12, right-hand panel). Industrial product prices do not show significant variation and their contribution to annual inflation in 2025 will be minimal.
6.Monetary policy of the Eurosystem
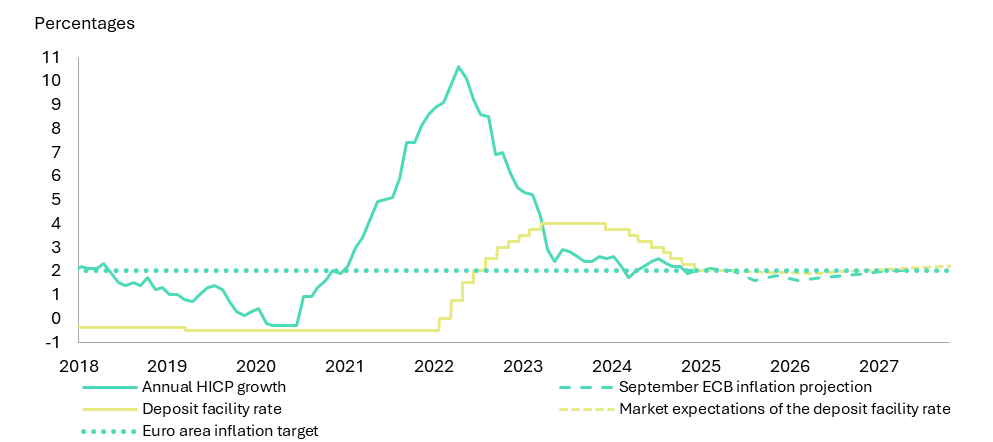
As inflationary pressures eased, the ECB Governing Council continued to cut key interest rates. The decisions to cut interest rates were taken following an updated assessment of the inflation outlook, development of underlying inflation and strength of monetary policy transmission. With these criteria indicating that inflation should remain close to the 2% target over the medium term, the monetary policy stance was gradually eased. Interest rates have been cut eight times in just over a year, with the key deposit facility rate reaching 2% in June 2025, a level maintained at the July and September meetings. The size of the Eurosystem’s balance sheet continued to decline as securities purchased for monetary policy purposes matured.
Inflation declined and is broadly in line with the ECB’s target level. Since October 2022, when inflation in the euro area was above 10%, it fell to 2.1% by August 2025 (see Chart 14). This was compounded by significant interest rate hikes from July 2022. The ECB’s projections suggest that inflation could temporarily fall further next year on the back of negative energy inflation and appreciated euro but should return to the level of 2% in the medium term. With inflation relatively stable, financial market participants expect interest rates to remain at a similar level in the future. However, the ECB Governing Council will take decisions at each meeting following a data-dependent approach.
Key ECB interest rates fell further as inflation sustainably dropped to the target level.
Chart 14. Actual data on interest rates and inflation in the euro area and market expectations
Sources: ECB and LSEG Datastream.
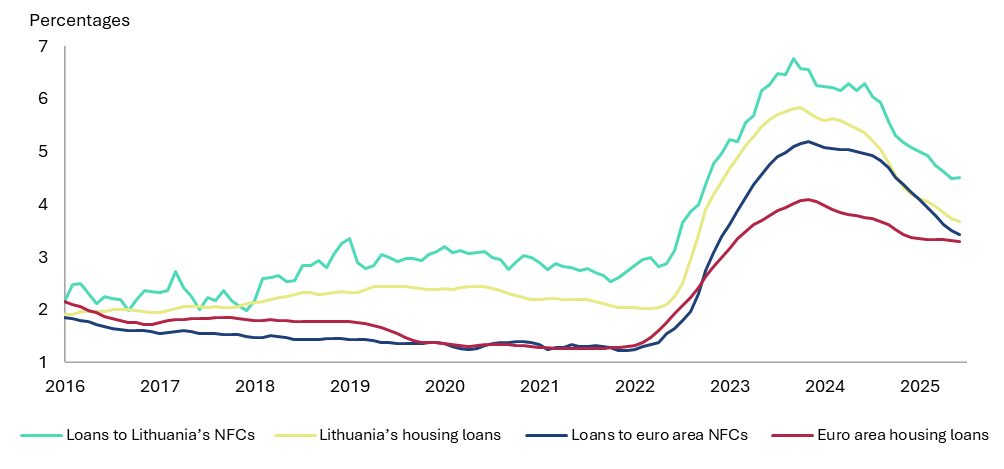
Lending rates continued to fall in line with the key ECB interest rate cuts (see Chart 15). The strong growth of new lending rates in 2024 was replaced by their steady decline, which accelerated in both the housing and non-financial corporation segments in Lithuania and across the euro area. This has been driven by the ECB Governing Council’s decisions to cut interest rates and expectations of further rate cuts. In Lithuania, interest rates on new housing loans are still above the euro area average, but the gap has been narrowing in recent years. These trends are partly explained by the fact that almost all housing loans in Lithuania (around 97%) have variable interest rates (usually 3, 6 or 12-month EURIBOR), while the euro area average is much lower (around 18%). As a result, Lithuanian borrowers were immediately affected by both higher and lower interest rates, while borrowers across the euro area were on average affected only when long-term interest rate expectations changed. The still higher lending rates in Lithuania could also reflect a greater concentration in the banking sector than the euro area average. The future dynamics of lending rates will depend not only on the nature of monetary policy and the economic situation but also on the financial conditions and margin policies of banks.
Financing conditions in the euro area as a whole and in Lithuania continued to ease.
Chart 15. Average interest rates on new MFI housing loans and loans to NFCs
Sources: ECB and Lietuvos bankas calculations.
Notes: 3-month moving average. Excluding revolving loans and overdrafts.
The update to the ECB monetary policy strategy of June 2025 confirms the unchanged main target of 2% inflation in the euro area over the medium term, but greater emphasis is placed on flexibility and the ability to respond swiftly to surprises. The strategy stresses that the inflationary environment has become more volatile in recent years and that the drivers of inflation such as the ageing society, deglobalisation or geopolitical environment can affect it in both directions. This environment requires flexibility and decisive response as demonstrated after the spike in inflation in 2022–2023, when interest rates were raised by as much as 4.5 percentage points in just over a year. Interest rates are expected to remain the main monetary policy instrument, but other non-standard measures may be used if necessary. The ECB will respond to the heightened uncertainty and risks by incorporating alternative scenarios and sensitivity analyses into its decision-making process.
7.Financing of the economy
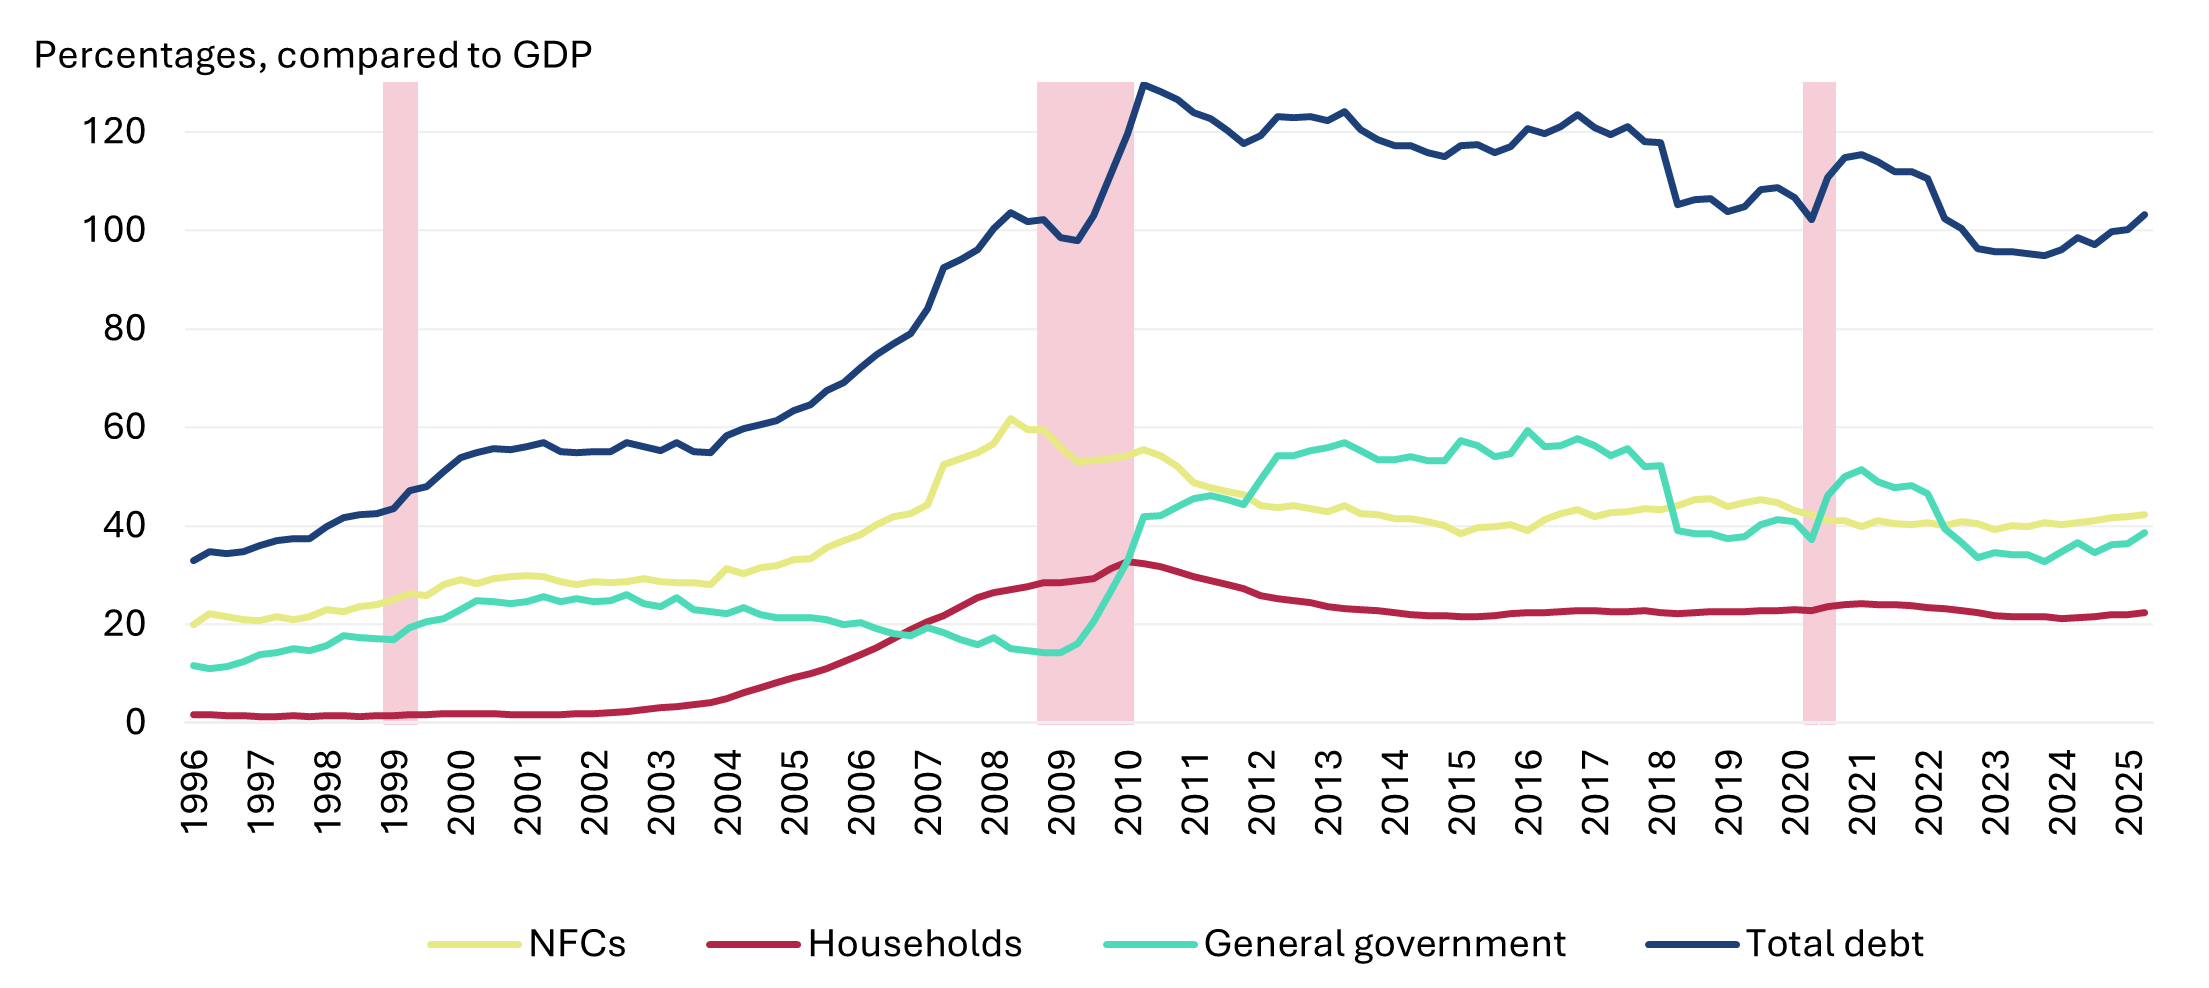
Currently, Lithuania’s government debt to GDP ratio is in line with the EU Maastricht criteria and the debt service burden is low, reflecting short-term financial stability. Another important aspect is the credit growth rate: if credit grows twice as fast as GDP for several years in a row, this is an alert of a potential correction (see Chart 16 for 2008–2009). An economy that is overly dependent on credit becomes particularly vulnerable to changes in interest rates and external shocks. The general government foreign liabilities accounted for 68.3% of total debt in 2024 (annual growth of 5.1%). Around three quarters of the maturities of general government debt are medium-term (between 5 and 30 years). According to Lietuvos bankas, current defence needs without sustainable revenues will increase government debt to more than 60% of GDP in the long term and the burden of servicing this debt to more than 2% of GDP.
Total debt will return to over 100% of GDP and will grow faster due to defence needs.
Chart 16. Historical development of Lithuanian debt and its components
Source: Lietuvos bankas.
Private non-financial sector financial liabilities are increasing moderately. In the first quarter of 2025, household liabilities grew much slower than in the same period a year earlier, by 8.6% (24% in the first quarter of 2024). This increase was mainly due to higher amounts of trade credits and payables. Corporate liabilities grew at a similar pace (annual growth stood at 8.5% in the first quarter of 2025), mainly driven by increased financing through long-term and short-term loans from banks and other non-financial corporations, as well as a rise in the portfolio of short-term trade credit. With liabilities growing moderately, net financial assets grew faster: net financial assets of households reached €60 billion (annual growth of 10%), mainly reflecting assets accumulated in pension funds, higher non-overnight deposits and receivables, while those of non-financial corporations increased by €21 billion (annual growth of 13%), largely due to investments in unlisted shares, short-term loans granted, and trade credits.
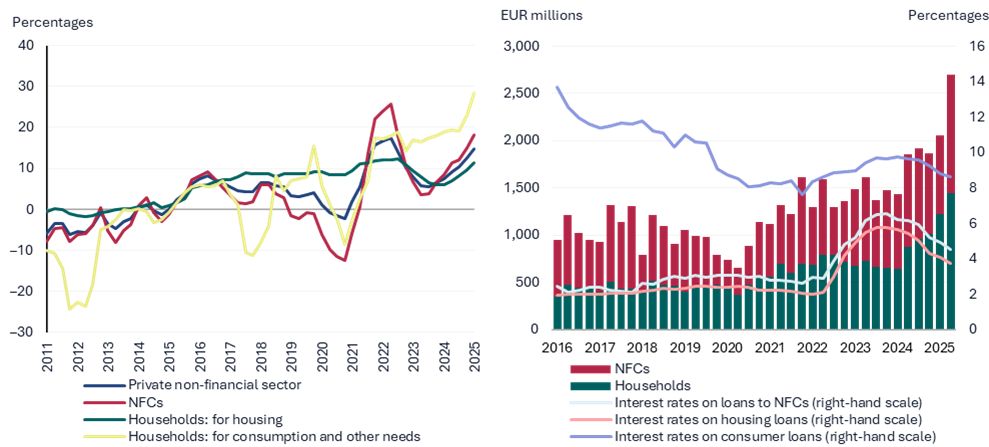
Corporate borrowing in Lithuania is gaining momentum, with banks expecting a further increase in the demand for corporate loans. With interest rates on corporate loans falling (see Chart 17, right-hand panel), the loan portfolio of non-financial corporations grew at an annual rate of 19.5% at the end of the second quarter of 2025, driven by lending to manufacturing and RE companies (see Chart 17, left-hand panel). This growth was significantly faster than in the euro area as a whole and in Lithuania six months earlier (2.3% and 12% respectively). The total quarterly loan flow was more than 25% higher than a year earlier, largely due to higher average loan values. The ratio of corporate loans to GDP continues to show a significant decline over the decade, but a slight increase over the year, reaching 16% in the first quarter of 2025. The Bank Lending Surveys of Lietuvos bankas indicate that the demand for corporate loans continued to grow moderately in the second quarter of 2025 and is expected to increase in the third quarter, especially in the SME segment. Although the share of rejected or partially granted corporate loan applications increased slightly for the second consecutive quarter, the same period recorded the first overall easing of lending standards in more than three years, albeit modest. For the third consecutive quarter, banks considered that the financial health of companies in the accommodation and food services sector was the worst, while the assessment of construction and transport firms improved for three consecutive quarters. Overall, banks currently view the financial situation of companies as stable or improving.
The annual growth of the MFI loan portfolio accelerated across all segments of loans to the non-financial private sector.
Chart 17. Annual change in the portfolio of MFI loans to Lithuanian NFCs and households (left-hand panel), and quarterly flows of loans and average interest rates on new loans (right-hand panel)
Source: Lietuvos bankas.
The quality of the loan portfolio continued to improve, as the level of non-performing loans in both the corporate and household segments further declined. At the beginning of 2025, the number of corporate insolvencies remained broadly unchanged and the level of corporate non-performing loans remained low (1.2%), while a significant improvement in the quality of loans granted by MFIs was observed in most key industries compared to the same period last year, particularly in the manufacturing, transport and accommodation sectors. The level of non-performing housing and consumer loans of households improved in the first quarter of 2025 year on year and stood at 0.7% and 2.3% respectively.
8.General government finance
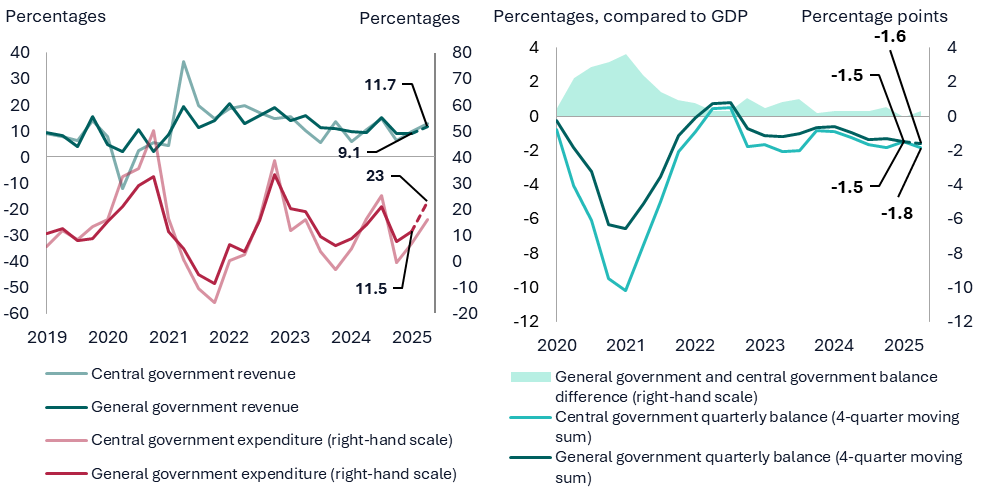
In the first half of 2025, the financial situation of the general government deteriorated further, with expenditure again outpacing revenue. Compared to 2024, the ratio of general government balance to GDP declined by 0.2 percentage points in the first quarter of 2025 to -1.5% of GDP (measured on a 4-quarter moving sum). Preliminary estimates of Lietuvos bankas, which are based on central government data, show that the growth rate of expenditure was even higher than that of revenue in the second quarter (see Chart 18, left-hand panel). As a result, general government deficit is likely to have widened by a further 0.1 percentage point to -1.6% of GDP in the second quarter (see Chart 18, right-hand panel). The general government deficit observed in the first half of 2025 was at its highest level since the end of the third quarter of 2021, when the general government deficit was large due to higher spending on COVID-19 pandemic mitigation and higher than the historical average for 2015–2019.
In the first half of 2025, the general government deficit widened further and reached its highest level since the end of the third quarter of 2021.
Chart 18. Development of general and central government revenue and expenditure (left-hand panel), and balance sheet (right-hand panel)
Sources: State Data Agency, Ministry of Finance and Lietuvos bankas calculations.
Note: Dotted lines indicate the estimates of corresponding indicators calculated by Lietuvos bankas.
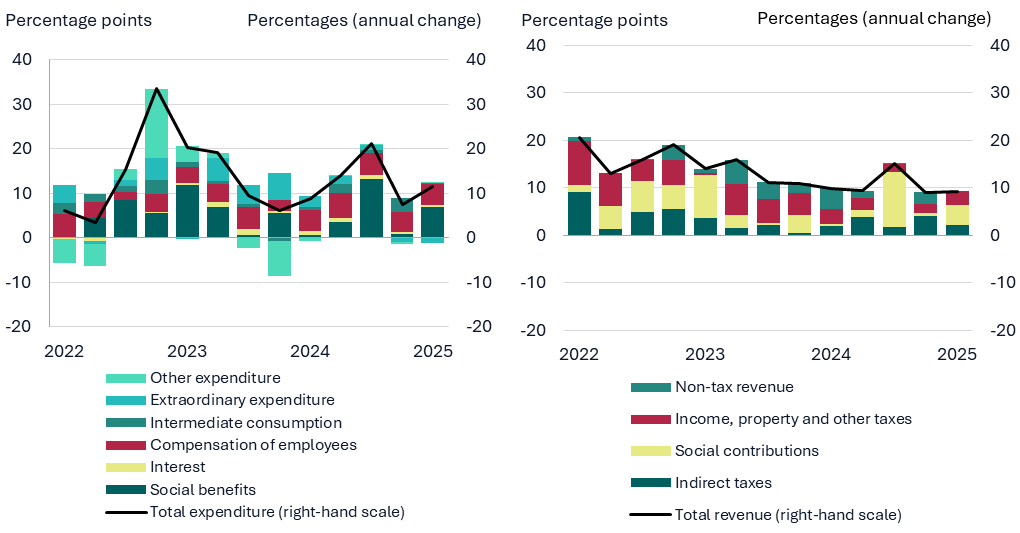
The growth of general government expenditure in the first quarter of 2025 was 11.5% and is likely to have exceeded 20% in the second quarter (see Chart 19, left-hand panel). In the first quarter, the rise in general government expenditure was mainly driven by higher social benefits. The increase in social benefits is partly explained by the higher expenditure on persons insured by the state budget due to the nature of statistical accounting as well as the adjustment of the minimum monthly wage and other indicators since the beginning of the year (such as the minimum consumption needs, basic social benefits, basic pensions, etc.) which are used to calculate various social benefits. Higher compensation of employees also contributed to the rise in spending in both the first and second quarters, with the wage bill of education and health sector employees continuing to grow at the fastest pace year on year. Monthly data published by the State Data Agency and State Social Insurance Fund as well as the estimates of Lietuvos bankas based on them suggest that higher intermediate consumption and subsidy expenditure also contributed to the faster growth of general government expenditure in the second quarter.
General government revenue growth in the first and second quarters of 2025 was more moderate than expenditure growth but remained strong (9.1% and potentially 11.7% respectively) (see Chart 19, right-hand panel). In the first quarter, the rise in social contributions was the main contributor to the increase in general government revenue. As in the case of general government expenditure, the uptick in contributions from persons insured by the state was due to the nature of statistical accounting, resulting in higher social contributions in the first quarter. Social contributions in the first and second quarters were also boosted by continued rise of wages, which increased social security contributions. Rising wages and consequent consumption also pushed up personal income tax, value added, and excise revenue. It should be noted that the significant increase in fuel excise duties since the beginning of the year and the resulting significant drop in fuel sales at the beginning of the year did not prevent the achievement of the annual excise duties revenue plan; excise duty collection between February and July 2025 was almost 5% higher than in the same period in 2024. Although excise duty collection from gas oils decreased significantly in this period, these losses were offset by increased collection from tobacco products, alcohol, and petrol excise duties.
The main contributors to the rise in general government expenditure were higher social expenditure and staff wages. The main contributors to the increase in general government revenue were higher social contributions, personal income tax, VAT, and excise revenue.
Chart 19. Annual development and contributions of general government expenditure (left-hand panel) and revenue (right-hand panel)
Sources: State Data Agency and Lietuvos bankas calculations.
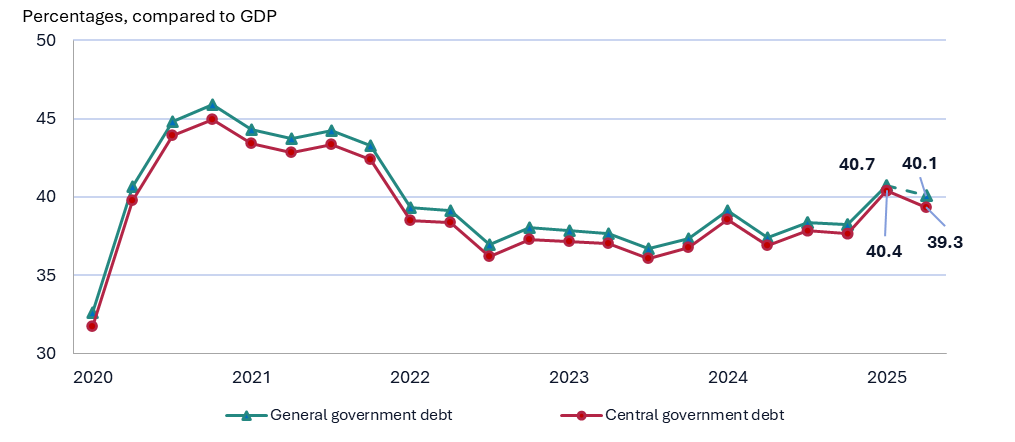
At the end of the first half of 2025, the general government debt to GDP ratio is likely to be 40%. However, due to the increasing need for defence spending, the debt level is projected to be above 42% at the end of the year.
Chart 20. Development of general and central government debt
Sources: Ministry of Finance, State Data Agency and Lietuvos bankas calculations.
Note: Dotted lines indicate the estimates of corresponding indicators calculated by Lietuvos bankas.
Prepared by Vaidotas Tuzikas
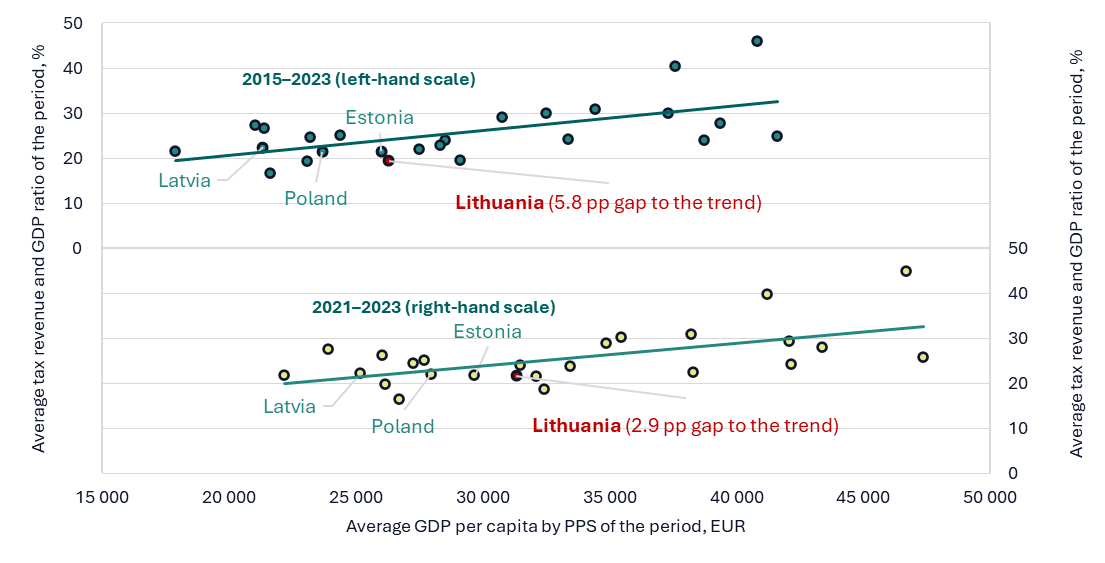
In June of this year, the Lithuanian authorities approved a package of tax changes aimed at increasing the financing of the National Defence Fund and ensuring sustainable long-term revenues for the national budget. It is claimed that the amendments to the Republic of Lithuania Law on Personal Income Tax (PIT) are aimed at distributing the tax burden more fairly and reducing income inequality, therefore a higher progressive tax rate is set for higher incomes (a new 25% PIT rate is introduced), coupled with the application of uniform PIT rates to different types of income (except for dividends, certain income from the sale of shares, income of residents engaged in agricultural activities, and certain other payments). The business community has been sceptical about these tax changes arguing that they pose a very real threat of a drain of skilled, well-paid labour, and capital out of the country. Therefore, this box will discuss the adopted PIT changes and how these changes and additional PIT revenue will affect the effective PIT rate and the burden of labour taxation in Lithuania compared to other EU/OECD countries.
Chart A. Relationship between tax revenue and development level in EU countries in 2015–2023
Sources: Eurostat and Lietuvos bankas calculations.
Note: PPS – purchasing power standard.
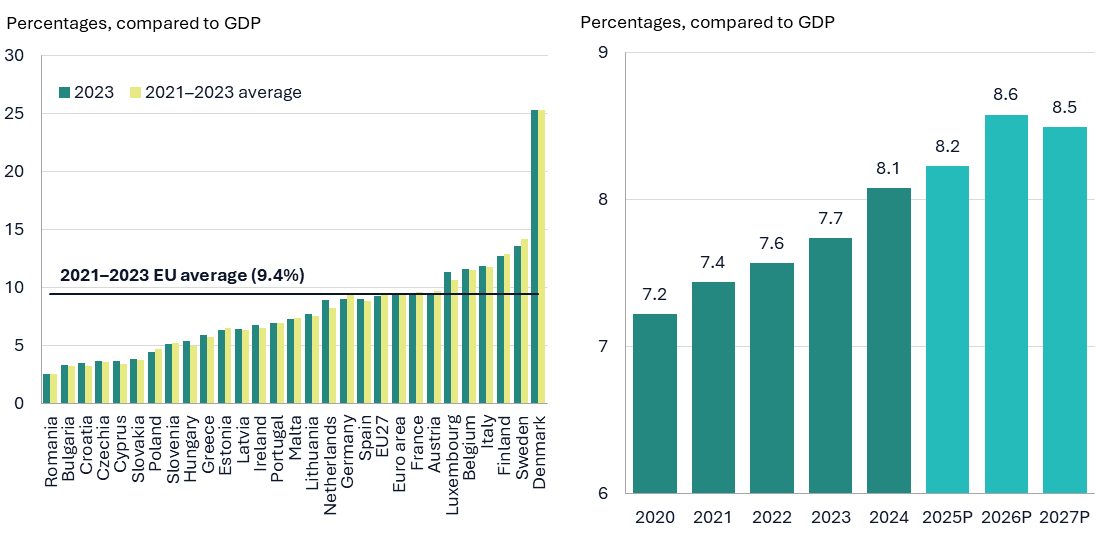
Lithuania’s ratio of collected PIT revenue to GDP is still below the EU average, but has grown steadily outperforming collection in the neighbouring countries. According to data provided by Eurostat, the amount of PIT revenue collected by Lithuania was 7.7% of GDP in 2023 and was below the EU average of PIT revenue (see Chart B, left-hand panel). Compared to neighbouring countries (Estonia, Latvia, and Poland), Lithuania’s ratio of collected PIT revenue to GDP was the highest in 2023, but this was not a one-off phenomenon as a longer-term perspective shows that Lithuania’s average ratio of PIT revenue to GDP was also the highest in 2021–2023. The latest actual data suggest that the ratio of PIT revenue to GDP increased further in 2024 to around 8.1%, while the estimate of Lietuvos bankas of the PIT revenue to GDP ratio based on the 2025 budget plan indicates that the ratio should improve slightly further this year (to around 8.2%, see Chart B, right-hand panel).
Chart B. PIT* revenue in EU countries in 2019–2023 (left-hand panel) and development of PIT revenue to GDP ratio** in Lithuania (right-hand panel)
Sources: Eurostat, Ministry of Finance, State Data Agency and Lietuvos bankas calculations.
Note: P – projection.
* Countries are ranked by 2023 data, from lowest to highest ratio. The chart shows country data by national accounts category “D51A_C1 Taxes on individual or household income including holding gains”.
** The estimates for 2025–2027 are compiled by Lietuvos bankas on the basis of publicly available information on GDP at current prices, development of the wage bill, planned collection of PIT revenue, and fiscal impact of approved PIT changes.
The estimate of Lietuvos bankas shows that the PIT revenue to GDP ratio will increase to around 8.6% in 2026, further approaching the EU average (see Chart B, right-hand panel). In June, changes to the PIT were approved, introducing more progressive income taxation from 2026 onwards (new 25% PIT rate, income aggregation). The Law on Personal Income Tax introduces an additional TEI rate for parents (€1,044 per year per child), which will apply from 2027. According to the calculations presented in the explanatory memorandum to the draft law, these changes are projected to generate around €225 million (0.3% of GDP) in additional PIT revenue in 2026. However, almost €90 million will be lost in 2027 due to the application of the additional TEI rate for children, resulting in a slight decrease in the overall PIT revenue to GDP ratio, but the ratio will still be high from a historical perspective and is likely to come even closer to the average of EU countries.
Chart C. PIT rates in EU countries in 2025
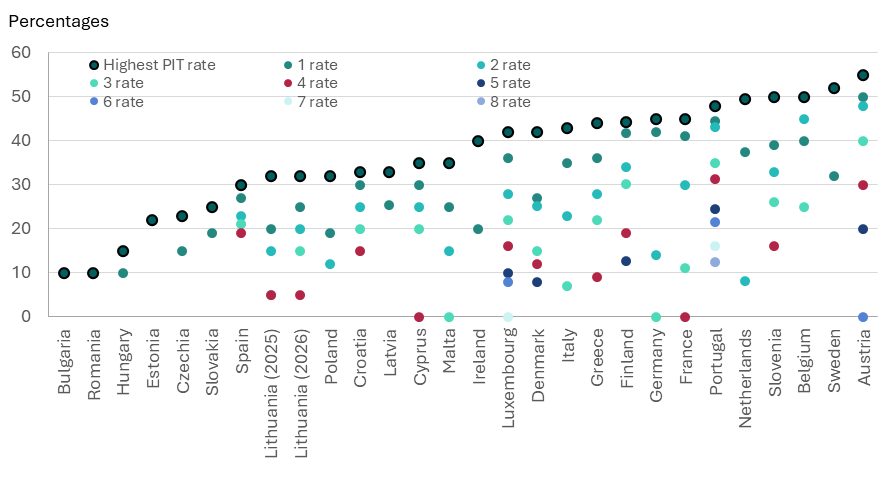
Sources: Prepared by Lietuvos bankas based on PwC Worldwide Tax Summaries using the analytical capacity of ChatGPT Enterprise.
Note: Countries in the chart are ranked according to the highest applicable PIT rate.
Chart D. Tax wedge in Lithuania
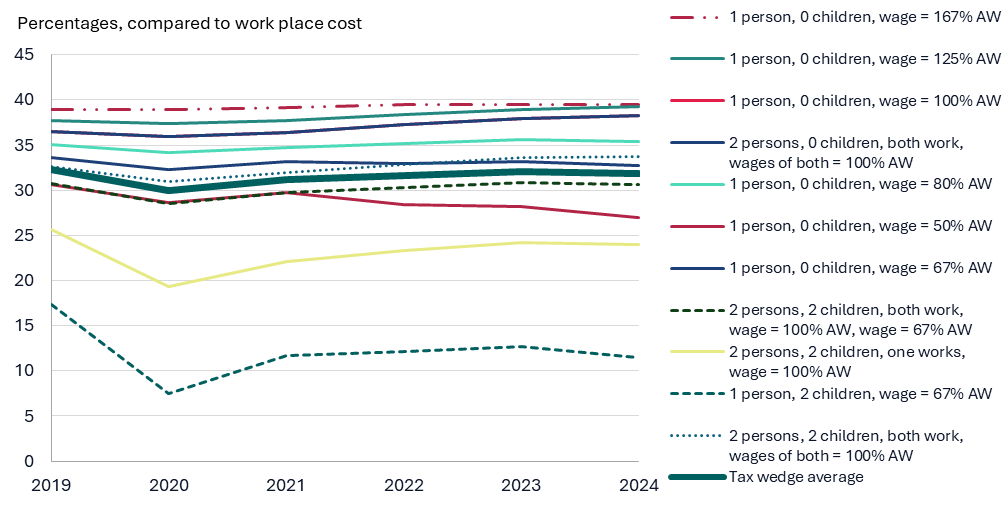
Sources: Eurostat and Lietuvos bankas calculations.
The tax wedge is unlikely to increase significantly in Lithuania due to the new progressive PIT rate as it is mainly driven by state social insurance contributions rather than PIT. The tax wedge is the difference between the costs incurred by an employer to hire an employee and the after-tax wages received by that employee. There is a consensus in the economic literature that increasing taxation of labour can raise the tax wedge and thus affect the demand for and supply of labour. The level of labour taxes affects household decisions on whether to participate in the labour market and how many hours to work and, as a factor on the demand side of the labour market, labour taxes affect the decisions of companies to hire. As already mentioned, the amendments approved in June introduce a new 25% PIT rate from 2026, which will apply to annual incomes between 36 and 60 average wages or monthly incomes between 3 and 5 average wages. Chart D shows that households with no children are exposed the largest tax wedge, while the wages of 1 or 2 workers fall between 1 and 2.67 average wages (see Chart D). Therefore, a 25% PIT rate introduced for relatively high incomes is unlikely to affect the tax wedge of lower-income households as shown in Chart D.
9.Abbreviations
AW average wage
CIS Commonwealth of Independent States
ECB European Central Bank
EU European Union
Eurosystem European Central Bank and euro area central banks
GDP gross domestic product
GG general government
HICP Harmonised Index of Consumer Prices
IMF International Monetary Fund
IT information technology
MFI monetary financial institution
MMW minimum monthly wage
NBP National Bank of Poland
OECD Organisation for Economic Cooperation and Development
PIT personal income tax
RE real estate
SDA State Data Agency
TEI tax-exempt income
US United States of America
VAT value added tax
|
© Lietuvos bankas, 2025 Gedimino pr. 6, LT-01103 Vilnius The Lithuanian Economic Review analyses the developments of the real sector, prices, public finance and credit in Lithuania, as well as the projected development of the domestic economy. The material presented in this review is the result of statistical data analysis, modelling and expert assessment. The review is prepared by Lietuvos bankas. The cut-off date for the data used in the publication is 1 September 2025, except for information on monetary policy decisions. Reproduction for educational and non-commercial purposes is permitted provided that the source is acknowledged. ISSN 2029-8471 (online) |