
Summary
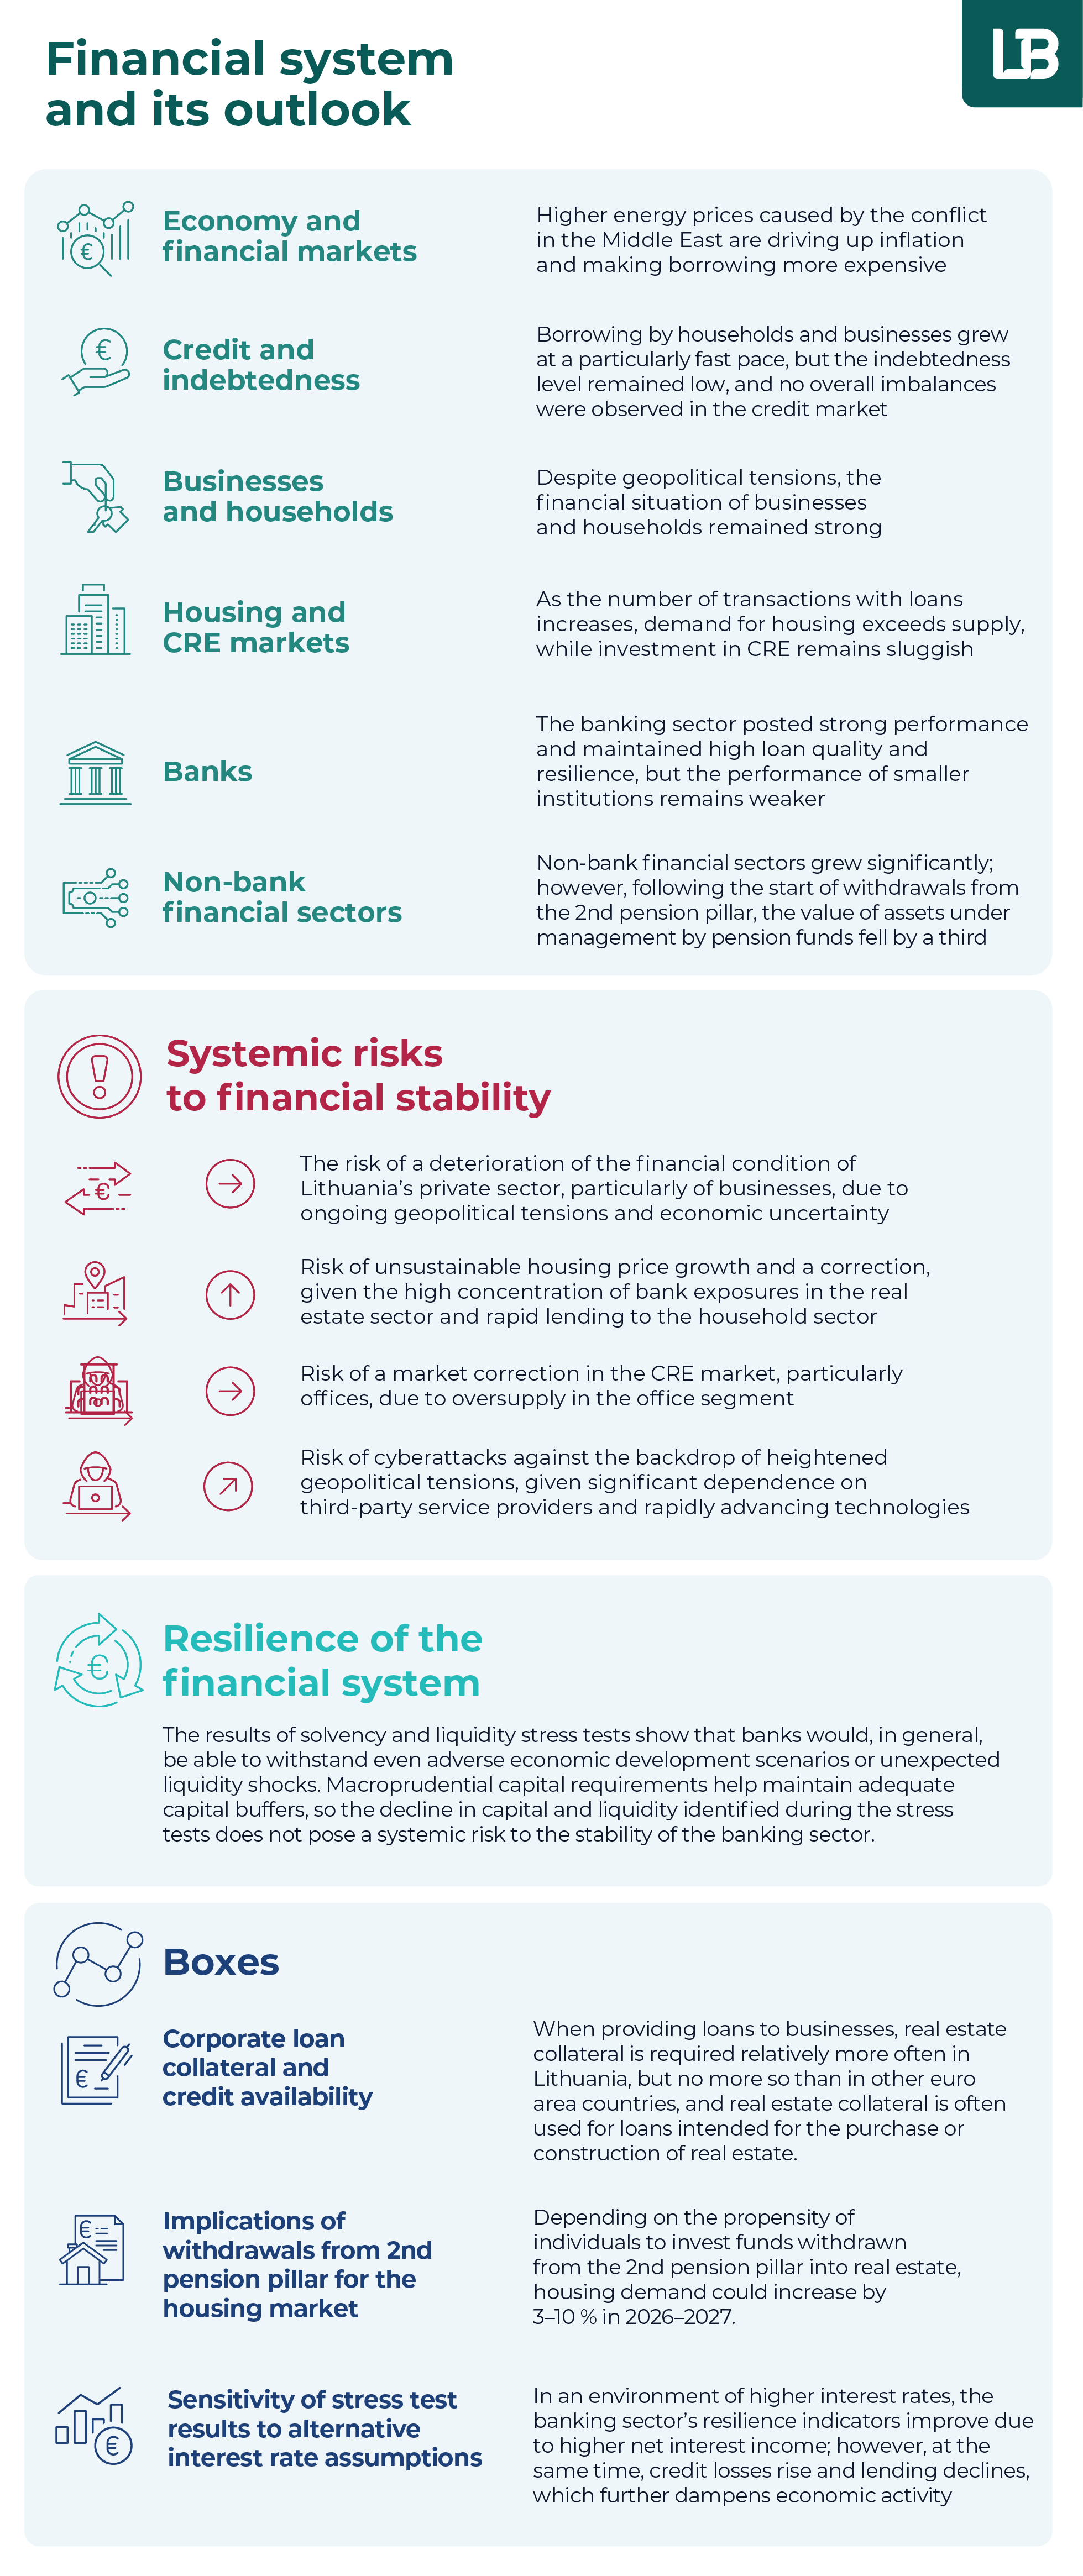
The trend of global economic growth continued in 2025–2026, but elevated tensions posed a risk to financial stability. Equity markets continued to rise, dipping only temporarily during the periods of peak tension, and reflected the positive outlook. However, the outbreak of the conflict in the Middle East in the first quarter of 2026 had a global lasting impact, particularly due to rising energy prices. Projections indicate that this will lead to higher inflation in Lithuania and the euro area as a whole, though the increase will not be as significant as in 2022. Concerns over the growing inflationary pressures led to expectations of tighter monetary policy and an increase in EURIBOR. This, in turn, has raised borrowing costs for both households and governments. Yields on Lithuanian government securities have also risen in this environment, though the change was in line with other countries. Overall, although the financial system remains resilient despite the challenging geopolitical environment. However, a further escalation of the conflict in the Middle East could trigger a repricing in financial markets, increased credit risk, weaker government debt sustainability and a deterioration in the quality of the banking sector’s assets.
Given the sound economic situation in Lithuania, the financial position of businesses and households was strong, but the energy crisis could have an adverse effect on their ability to meet their obligations. In 2025, sales grew in most major economic sectors, while the number of newly initiated bankruptcy proceedings continued to decline. The manufacturing, transport, and agriculture sectors, which are more sensitive to changes in export demand, energy prices and energy supply disruptions, face the greatest risk of a direct impact from the conflict in the Middle East. The probability of default in these sectors is mitigated by low debt levels, good loan portfolio quality as well as sufficient debt service capacity and liquidity buffers. However, due to interconnectedness or prolonged disruptions in energy supply, vulnerabilities could spread to other companies through secondary channels. In turn, wages that have risen rapidly over the past few years have contributed to improved household saving capacity and increased borrowing, but these trends may be dampened by the expected rise in energy prices and inflation. A significant share of borrowing at variable interest rates makes households, particularly those with the lowest income, more sensitive to rise in EURIBOR rates. Provided the conflict in the Middle East does not escalate into a deeper crisis, households should remain able to weather short-term shocks. Their resilience is underpinned by accumulated savings, funds withdrawn from the second pillar pension fund, and RLR measures that limit borrower risk.
Lending to households and businesses was among the fastest growing in the euro area, although debt levels remain low and access to credit for some businesses is constrained by collateral requirements. The growth rates of credit to the private non-financial sector accelerated significantly over the year, reaching historical highs. However, the level of indebtedness to credit institutions in Lithuania remains among the lowest in the euro area. Households actively borrowed for housing, consumption and other purposes, while lending to businesses covered both large firms and SMEs across most major economic sectors. Despite rapid credit growth, no broad credit market imbalances were observed, while some businesses continued to face structural challenges in accessing finance, as real estate collateral is required relatively more frequently in Lithuania than in other EU countries. This is partly explained by the purpose of the loans and the greater importance of SMEs in the national economy. Even so, there are indications that the existing measures do not sufficiently address the widespread requirement for real estate collateral. Due to limited access to bank financing, companies seek alternative sources of funding. As a result, the volume of funds raised on bond and crowdfunding markets has grown significantly in recent years, while the strengthening role of ILTE is expected to further improve businesses’ access to financing in the future.
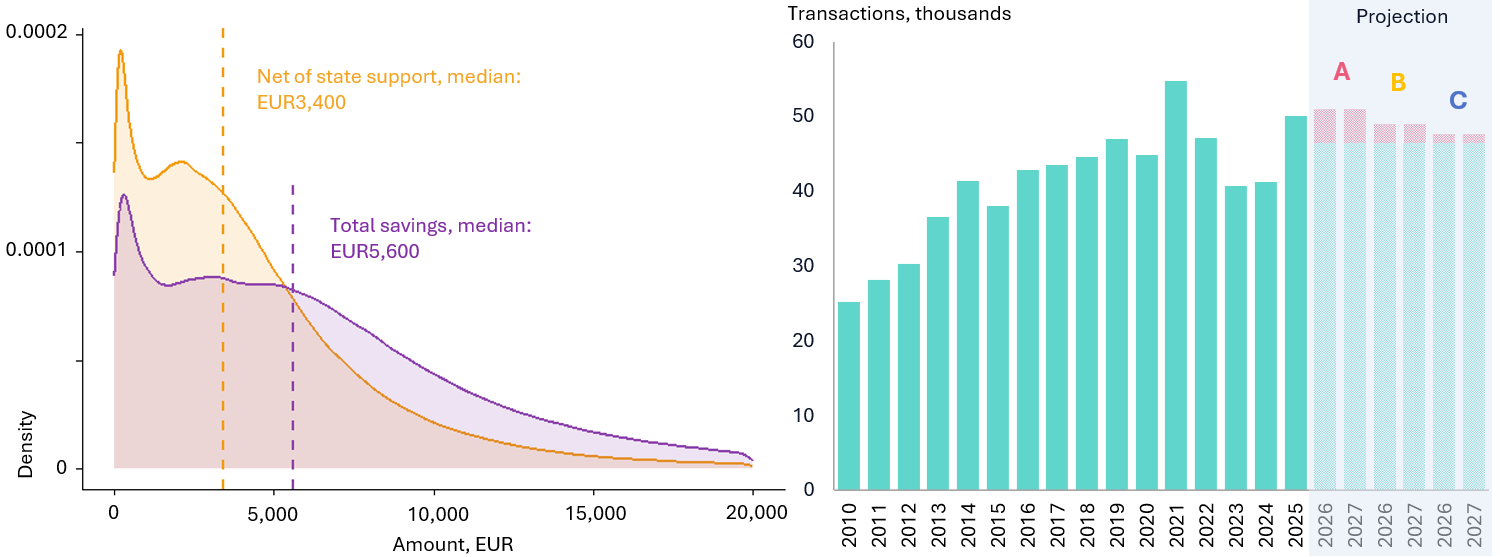
Risks in residential and commercial real estate differ according to the phase of the cycle. In housing, strong demand carries the risk of unsustainable price growth; in the Vilnius office segment, oversupply carries the risk of a price correction. Activity in the housing market is about 10–15% above its long-term trend and is expected to increase further due to withdrawals from the second pillar pension fund. Simulation results indicate that the number of housing transactions could increase by an additional 3–10 pp in 2026–2027 due to second-pillar funds. In case of a supply- demand mismatch, price imbalances could widen, making the housing market more vulnerable to shocks. On the other hand, low household debt levels and a sound financial position reduce the likelihood of risks materialising. Due to oversupply in the Vilnius office segment (vacancy rates are around 10%), the risk of price correction remains elevated. However, as the pace of new construction and price growth has slowed, the risk level in the Vilnius office segment has remained unchanged. The situation in other commercial real estate segments is favourable, with no imbalances observed.
The banking sector reported strong operating results, maintained high loan quality and a high level of resilience to potential shocks, but the performance of more significant institutions remained considerably stronger than those of less significant ones. Despite a decline in profitability, the Lithuanian banking sector remained among the most profitable in the EU. This was driven primarily by significant expansion of one market participant into foreign markets, net interest income, which – although declined over the year – remained historically high, and improved operational efficiency, largely attributable to more significant institutions. At the same time, the share of non-performing and high-risk loans in portfolios remained low. Stress tests of the banking sector’s solvency and liquidity conducted by Lietuvos bankas indicate that the capital depletion under an adverse scenario does not pose a risk to the stability of the sector, while large reserves of liquid assets would enable the banking sector to withstand potential liquidity shocks.
The risk from systemic cyber incidents has increased slightly. Prevailing geopolitical tensions continue to fuel cyber and hybrid attacks targeting strategically important sectors, while growing reliance of banks on third party service providers and rapidly evolving technologies, especially very rapid development of AI and increasingly sophisticated AI models, have increased the likelihood of systemic incidents for the financial system. However, cyber threat management remains high on the agenda, with supervision and cooperation continuing to strengthen at national and international levels, and financial institutions further increasing their investment in cyber resilience.
The development of key non-bank financial sectors in Lithuania is sustainable, despite a significant decline in the asset portfolio managed by pension funds. The withdrawal of second-pillar funds in early 2026 reduced pension funds’ assets under management by more than a third, from €11 billion to approximately €7 billion. However, this process does not pose any direct risks to financial stability. The investment fund and insurance sectors grew steadily: insurance companies operated profitably and met solvency requirements, while assets of investment funds increased by 11% over the year, and the importance of funds investing in equities and debt securities continued to grow. Capital and liquidity ratios of individual credit unions remained lower than those in the banking sector, highlighting the need to strengthen their resilience. In the fintech sector, about one-third of companies operated at a loss and their resilience to shocks varied greatly. The limited interconnection between the non-bank sector and banks helps to manage potential systemic risks.
The macroprudential policy measures in place remain appropriate to the current level of risk and to strengthening the resilience of the financial system. Changes to housing loan regulation are also contributing to a more active and competitive housing loan market. The CCyB rate of 1% remains appropriate to address the moderate level of cyclical risk that has built up in both the household and non-financial corporate sectors. Given the higher level of risk in the housing loan market, an additional 2% sector-specific SRB is applied to enhance the resilience of banks to potential losses. Rapidly increasing activity in the housing market and expansion of the consumer loan portfolio indicate a potential build-up of risks, although withdrawals from the second pillar pension scheme and RLR changes add uncertainty to the overall assessment of risk levels. These trends are being closely monitored and, if necessary, may be addressed by adjusting macroprudential capital requirements. The changes to the RLR, which will take effect on 1 August 2026, will contribute to a smoother functioning of measures and strengthen the resilience of borrowers in a changing interest rate environment. At the same time, more than a year after the amendments to the Republic of Lithuania Law on Real Estate Related Credit took effect, the volume of housing loan renegotiations and refinancing has more than doubled, indicating a significant pick-up in market activity, while consumers, taking advantage of these opportunities, are improving their loan terms considerably. Furthermore, following the entry into force of the requirement on 1 May 2025, the rapidly growing share of fixed-rate loans suggests that regulatory changes have broadened consumer choice and strengthened competition among lenders.
1.Status, risks and resilience of the financial system
1.1.Developments in the Lithuanian and international macroeconomic environment and financial markets
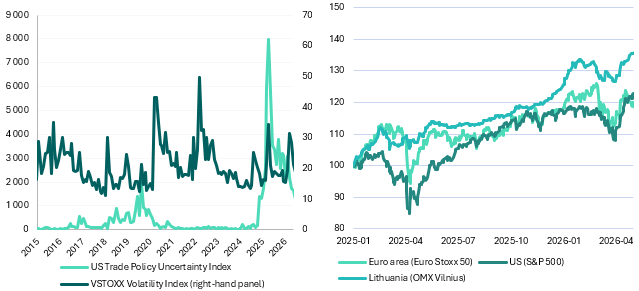
Stock indices rose, even though geopolitical tensions had an adverse effect on them.
Chart 1. Indices of uncertainty over trade and financial markets (left-hand panel) and stock indices (1/1/2025 = 100) (right-hand panel)
Sources: Lietuvos bankas and London Stock Exchange Group (LSEG).
Note: The Trade Policy Uncertainty Index measures the total monthly share of the number of articles in seven US newspapers referring to trade policy uncertainty (100 =1%). The VSTOXX is based on real-time option prices for the Euro Stoxx 50.
The stock markets followed an upward trend in 2025–2026, but economic shocks temporarily weighed on financial markets as well. In March 2026, following the US and Israeli strikes against Iran, tensions in the Middle East escalated and Iran, in response to these actions, launched strikes against the Gulf states and effectively halted energy supplies through the Strait of Hormuz leading to increased volatility in financial markets (see Chart 1, left-hand panel). Since the beginning of 2025, stock indices have risen significantly, driven primarily by the strong gains in major technology stocks, supported by expectations of continued AI development and adoption (see Chart 1, right-hand panel). The developments of euro area stock indices broadly mirrored those in the US. The Vilnius OMX index fell by a smaller margin than European and US indices both in April 2025, when tariff-related tensions intensified, and in March 2026, when the conflict in the Middle East began, and has therefore recorded stronger gains since the start of 2025. Overall, although market volatility was significant, it did not reach the levels seen during the COVID‑19 pandemic and at the onset of Russia’s invasion of Ukraine.
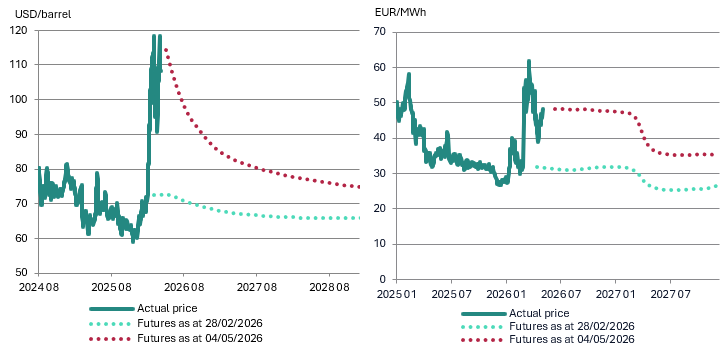
With the outbreak of conflict in the Middle East, energy prices have risen significantly, although futures indicate that they are likely to decline gradually (see Chart 2). Disruptions to oil and gas supplies through the Strait of Hormuz and increased concerns over the future supply security have led to a weaker energy supply and a sharp increase in prices. The price of Brent crude oil exceeded the $100 per barrel threshold for the first time since August 2022, while the price of Dutch TTF gas nearly doubled. However, these changes, while significant in the context of recent years, did not reach the levels observed at the onset of Russia’s invasion of Ukraine. Futures indicate that energy prices should decline but are expected to remain above their pre-conflict levels. In the longer term, oil prices are expected to remain higher by about $15 per barrel than before the conflict, and gas prices higher by about €10 per megawatt-hour. Despite these market expectations, the outlook for energy prices remains highly uncertain and their trajectory will depend on how quickly and smoothly disrupted energy supplies can be restored.
Higher energy prices are expected to gradually decline but remain at a higher level than before the conflict in the Middle East.
Chart 2. Prices and futures of Brent crude oil (left-hand panel) and Dutch TTF natural gas (right-hand panel)
Source: LSEG.
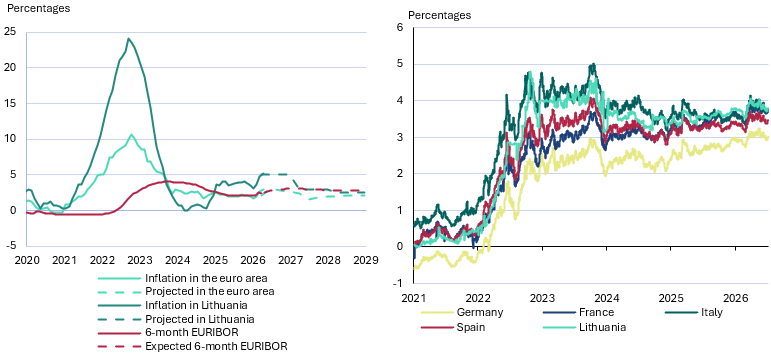
The yields of government securities grew in line with the inflation outlook.
Chart 3. Inflation, EURIBOR and their projections for Lithuania and the euro area as a whole (left-hand panel) and 10-year government bond yields (right-hand panel)
Sources: Lietuvos bankas, LSEG, IMF and Chatham Financial.
Note: The left-hand panel shows the projections of the ECB and Lietuvos bankas.
1.2.Credit and indebtedness developments
The portfolio of loans to the private non-financial sector grew strongly, but this pattern can be seen in euro area countries with lower levels of indebtedness to credit institutions.
Chart 4. Annual development of the portfolio of loans to NFCs and households (left-hand panel) and the level of private sector debt and annual growth of the loan portfolio (right-hand panel)
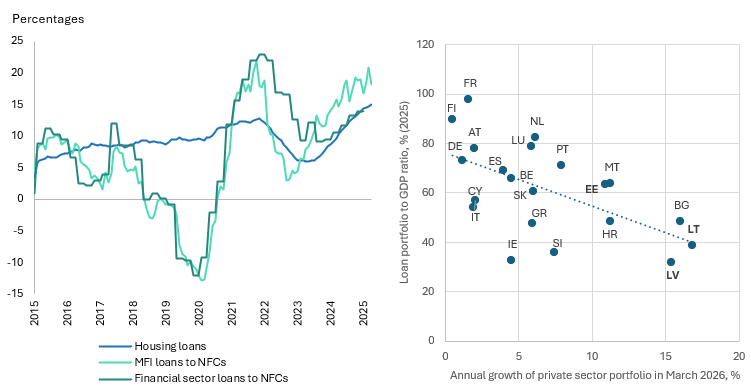
Sources: Lietuvos bankas, ECB and Eurostat.
Notes: Left-hand panel: the financial sector includes not only MFIs but also leasing and other financial companies that are the subsidiaries of banks;
right-hand panel: AT – Austria, BE – Belgium, BG – Bulgaria, CY – Cyprus, DE – Germany, EE – Estonia, ES – Spain, FI – Finland, FR – France, GR – Greece, HR – Croatia, IE – Ireland, IT – Italy, LT – Lithuania, LU – Luxembourg, LV – Latvia, MT – Malta, NL – Netherlands, PT – Portugal, SI – Slovenia, SK – Slovakia. For Ireland, gross national income is used for calculations instead of GDP.
Despite the upturn in the financial cycle, no broad-based credit market imbalances have been observed. The financial cycle in Lithuania grew significantly in 2025, with the broad credit-based index calculated by Lietuvos bankas reaching its long-term average at the end of the year (see Chart 5, left-hand panel). Despite a significant increase driven by strong lending activity, the level of corporate and household indebtedness remained among the lowest in the euro area. The MFI loan-to-GDP ratio stood at 39.4% at the end of 2025 (an annual increase of 3.4 percentage points). However, its deviation from the long-term trend remained negative, indicating that there are no signs of excessive lending.
Strong lending to households and businesses contributed to the significant growth of Lithuania’s financial cycle.
Chart 5. Lithuanian financial cycle index based on broad credit (left-hand panel) and change in household liabilities and its contributing factors (right-hand panel)
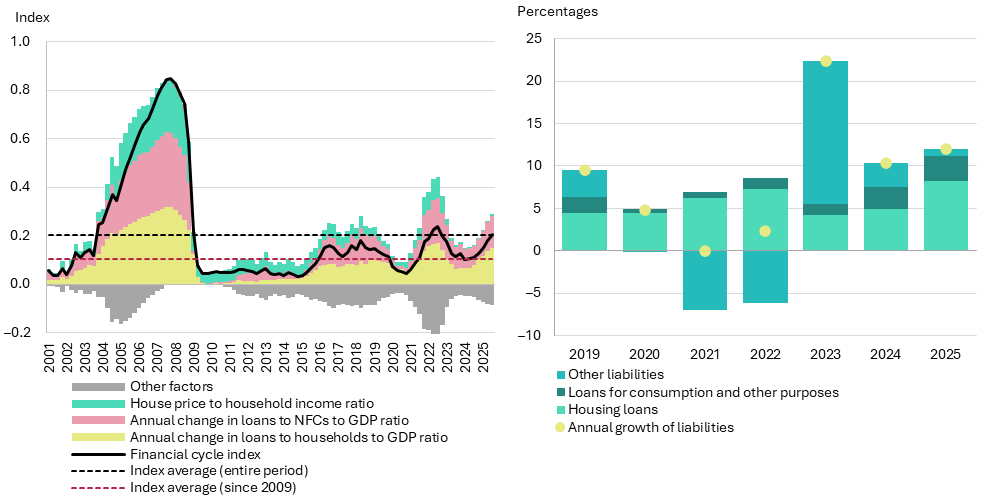
Sources: State Data Agency, Lietuvos bankas and Lietuvos bankas’ calculations.
Note: the left-hand panel uses a broader definition of credit, covering all credit extended regardless of the lender (not just MFIs).
Companies are increasingly turning to alternatives to bank loans to raise funding. A 2025 survey by the European Investment Bank shows that a significant proportion of Lithuanian SMEs still face difficulties accessing loans, and the share of micro and small enterprises complaining about tight collateral requirements remains one of the highest in the EU (see Box 1 for more on collateral requirements and access to credit for businesses). Limited access to bank financing drives companies to seek alternatives, and the flow of funds raised from other financing sources has grown significantly in recent years. In 2025, Lithuanian companies were actively borrowing from other NFCs and through trade credit, with the respective portfolios growing by 18% and 9% over the year. Companies raised nearly €380 million last year in the crowdfunding market and as much as €880 million in the bond market (annual growth of 36% and 90%, respectively; see Chart 6, right-hand panel). These funding sources accounted for 6.7% and 15.5%, respectively, of the funds lent by credit institutions to companies in 2025. Over the past few years, the share of bond issuers that have never had bank credit has increased significantly. This indicates that for some companies the bond market is becoming not only complementary to bank funding but, in certain cases, the only alternative.
In 2025, corporate financing accelerated through both credit institutions and non-bank financing sources.
Chart 6. Ratio of the corporate loan portfolio to gross value added and the annual growth of the loan portfolio by economic sector (left-hand panel) as well as corporate borrowing flows by source of financing (right-hand panel)
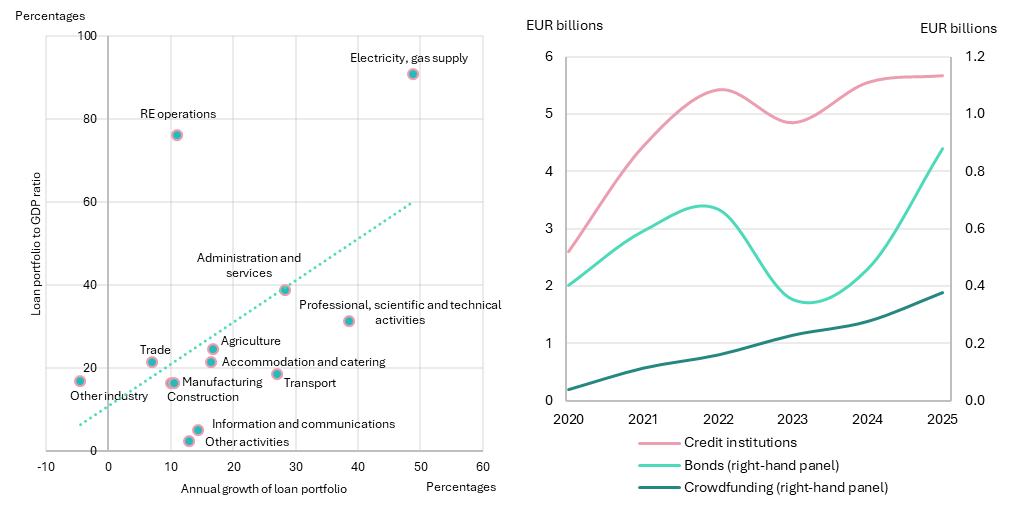
Sources: State Data Agency, Lietuvos bankas and Lietuvos bankas’ calculations.
Notes: GVA: gross value added. The loan portfolio and GVA ratio was calculated using the data for the MFI corporate loan portfolio in 2025 and GVA generated in 2024. Names of economic activities are abbreviated.
Prepared by Justinas Skurkis
Koufopoulos, K., McGowan, D., Perdichizzi, S., Reghezza, A. and Spaggiari, M. (2026) Risky collateral and default probabilityRisky collateral and default probability, ECB Working Paper Series No. 3167.
The high share of loans secured by real estate in Lithuania is partly explained by the importance of SMEs and the purpose of the loans.
Chart A. Share of loans secured by real estate and the share of real estate and construction sectors in the corporate portfolio (left-hand panel) and the loan-to-value ratio of collateralised loans to Lithuanian companies by company size and type of collateral (right-hand panel)
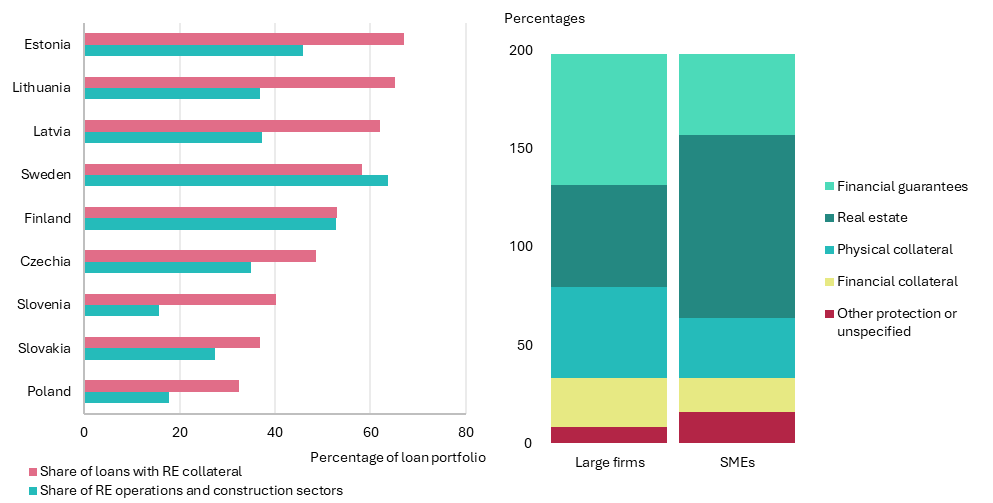
Sources: ESCB, Lietuvos bankas and Lietuvos bankas’ calculations.
Note: Only collateralised loans are included in the calculation of the loan-to-value ratio; finance lease loans are excluded.
1.3.Resilience of private non-financial sector
1.3.1.Resilience of corporate sector
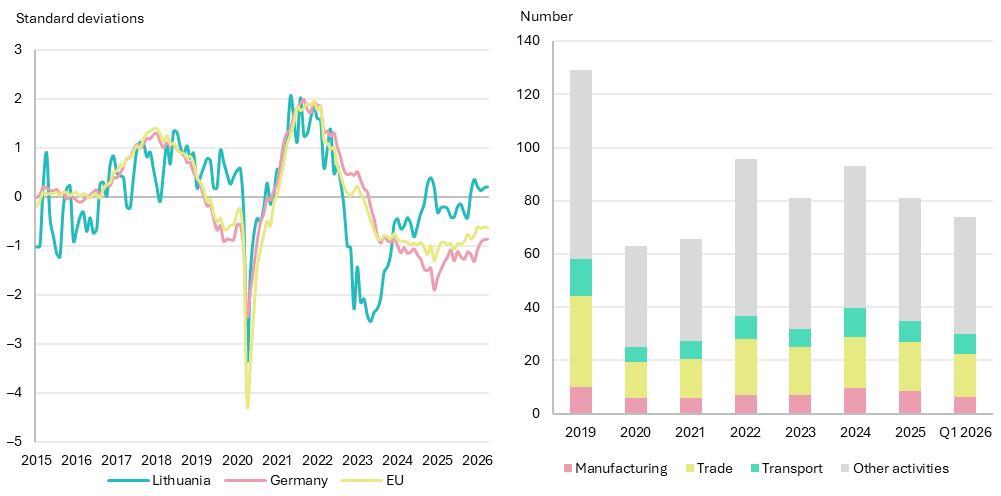
Over the past six months, expectations in industry have improved modestly, while the number of companies filing for bankruptcy has continued to decline in Lithuania.
Chart 7. The standardised deviation of the industrial confidence indicator from its historical average (2015–2026) in Lithuania, Germany and the EU (left-hand panel) and the average number of NFC bankruptcies per month (right-hand panel)
Sources: Eurostat, Authority of Audit, Accounting, Property Valuation and Insolvency Management and Lietuvos bankas’ calculations.
Note: Names of economic activities are abbreviated.
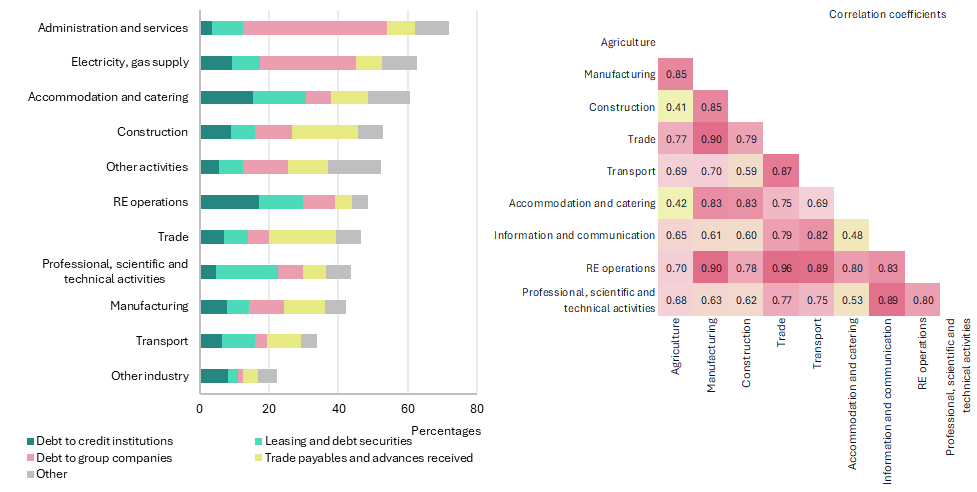
The levels of non-performing loans across Lithuania’s key corporate sectors have historically been closely correlated. Therefore, if vulnerabilities were to spill over into other economic activities, pressures on the quality of bank loan portfolios would increase. Over the past three years, the corporate loan portfolio in Lithuania has grown the fastest in the euro area by more than 45%, yet the quality of the loan portfolio has remained stable. The overall level of non-performing corporate loans remains historically low, with the share of non-performing loans in the sectors most vulnerable to geopolitical tensions and rising energy prices, i.e. agriculture, transport and manufacturing, decreasing over the year by 1.8, 0.5 and 0.4 percentage points respectively. The share of non-performing loans of companies in professional, scientific and technical activities increased by 2.3 percentage points over the year but remains relatively low in a longer-term context (2.6%). The high correlation of non-performing loan levels across key sectors, particularly manufacturing, trade and RE operations, indicates a potential contagion risk, with interactions between sectoral shocks leading to a greater deterioration in the quality of bank assets (see Chart 8, right-hand panel).
The sectors most sensitive to changes in export demand and energy prices are among the least leveraged; their non-performing loan levels remain low, but vulnerability could spill over to other sectors.
Chart 8. Ratio of corporate liabilities to assets by type of liability in 2024 (left-hand panel) and correlation of non-performing loan levels across sectors (right-hand panel)
Sources: State Data Agency, Lietuvos bankas and Lietuvos bankas’ calculations.
Note: Names of economic activities are abbreviated. The correlation coefficients were calculated using data from Q3 2014 to Q4 2025.
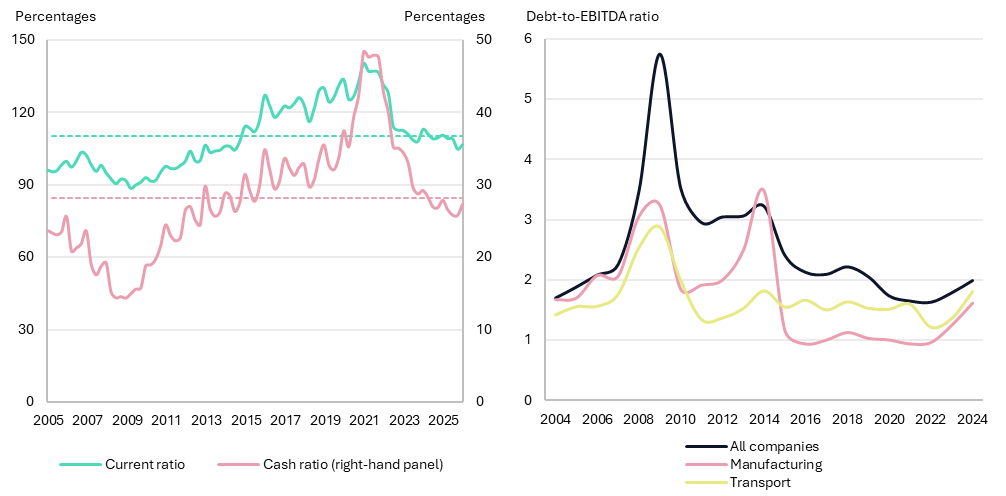
Corporate liquidity ratios remain close to historical averages and the debt service capacity of the most vulnerable sectors remains at a safe level.
Chart 9. Liquidity ratios (left-hand panel) and debt-to-EBITDA ratio (right-hand panel) of Lithuanian NFCs
Sources: State Data Agency, Lietuvos bankas and Lietuvos bankas’ calculations.
Notes: The dotted lines indicate the average values for 2005–2025. The current ratio is the ratio of current financial assets to current financial liabilities. Cash ratio is the ratio of cash to current liabilities. Debt includes long-term and short-term debt obligations and debts to credit institutions. EBITDA is earnings (loss) before income tax, financial performance, depreciation and amortisation. Names of economic activities are abbreviated.
In conclusion, geopolitical tensions and economic uncertainty may adversely affect the financial standing of companies and their ability to meet their obligations. The manufacturing, transport and agricultural sectors, which are more sensitive to export demand, energy prices and energy supply disruptions, face the greatest risk of immediate pass-through; but that vulnerability may spill over to other companies through secondary channels due to interconnections or persistent energy supply disruptions. The risk of default is mitigated by low debt levels, good loan portfolio quality as well as sufficient debt service capacity and liquidity buffers. However, should the unrest in the Middle East persist for an extended period, the level of risk would increase significantly.
1.3.2.Resilience of the household sector
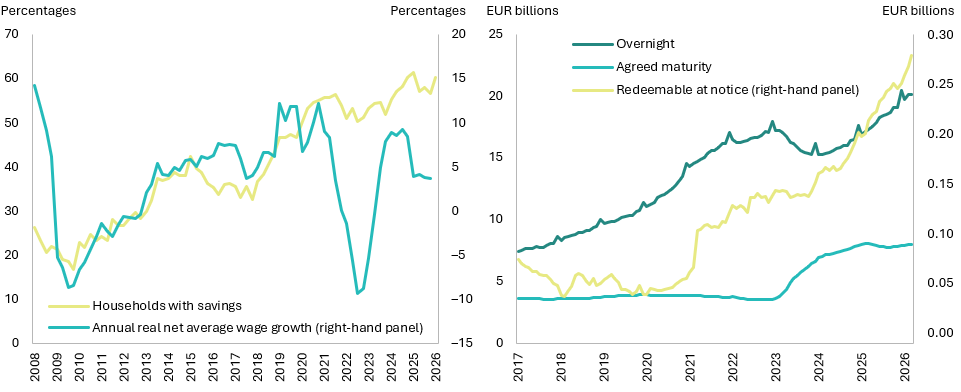
Household saving stabilised as inflation rose and time deposits stopped growing as interest rates fell.
Chart 10. Ability of households to save and wage growth (left-hand panel), development of household deposits by type (right-hand panel)
Sources: State Data Agency, Lietuvos bankas and Lietuvos bankas’ calculations.
Notes: The share of households that save is calculated by combining households that assess their current financial situation as ‘save a lot’ and ‘save a little’ and then calculating the 3-month moving average of this sum.
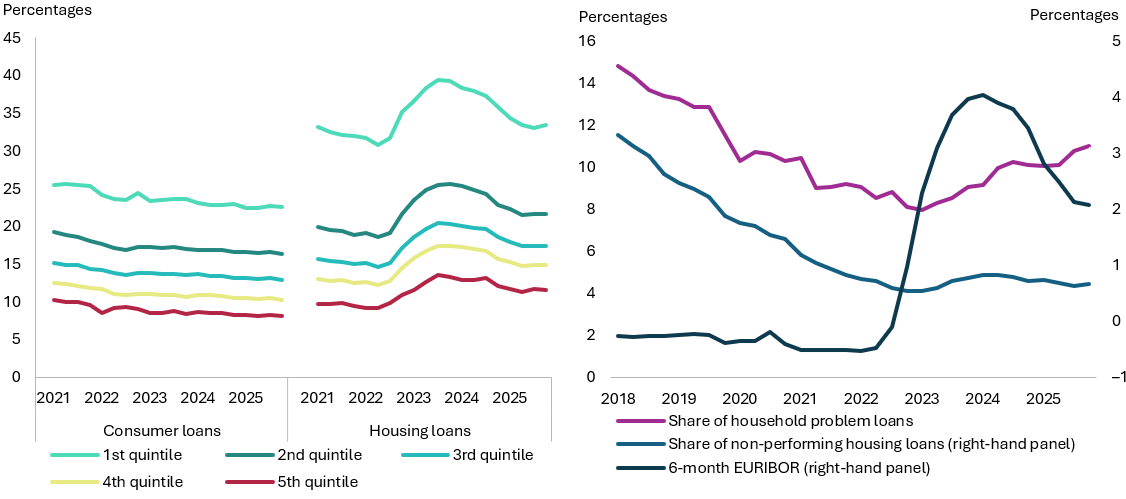
As interest rates rise, housing loan repayment costs for households increase, but this does not lead to insolvency problems for most borrowers.
Chart 11. Dynamics of the LSTI indicator of existing household loans by income quintile (left-hand panel), development of household loan quality and 6-month EURIBOR (right-hand panel)
Sources: Lietuvos bankas and Lietuvos bankas’ calculations.
Notes: Problem household loans are loans with increased credit risk and impaired household loans. The share of loans is compared to the relevant loan portfolio. The 6-month EURIBOR is shown as a 3-month moving average.
Amid ongoing geopolitical tensions and economic uncertainty, household resilience remains strong. The RLR also contribute significantly to resilience of borrowers by limiting excessive household borrowing and associated risks (for more details, see Chapter 2 Financial stability strengthening). Given that inflation and EURIBOR are currently projected to rise less than during the previous energy crisis (see Section 1.1 for more details), the household sector is likely to remain resilient. A more significant risk to financial stability could arise in the event of a deeper and more persistent crisis, which would severely worsen the financial situation of households and their ability to meet their obligations to credit institutions. The significance of risk would also increase if the growth rates of consumer and housing loans remained robust or accelerated further, raising the level of household indebtedness and the weight of these exposures on the balance sheets of credit institutions.
1.4.Trends in housing and CRE markets
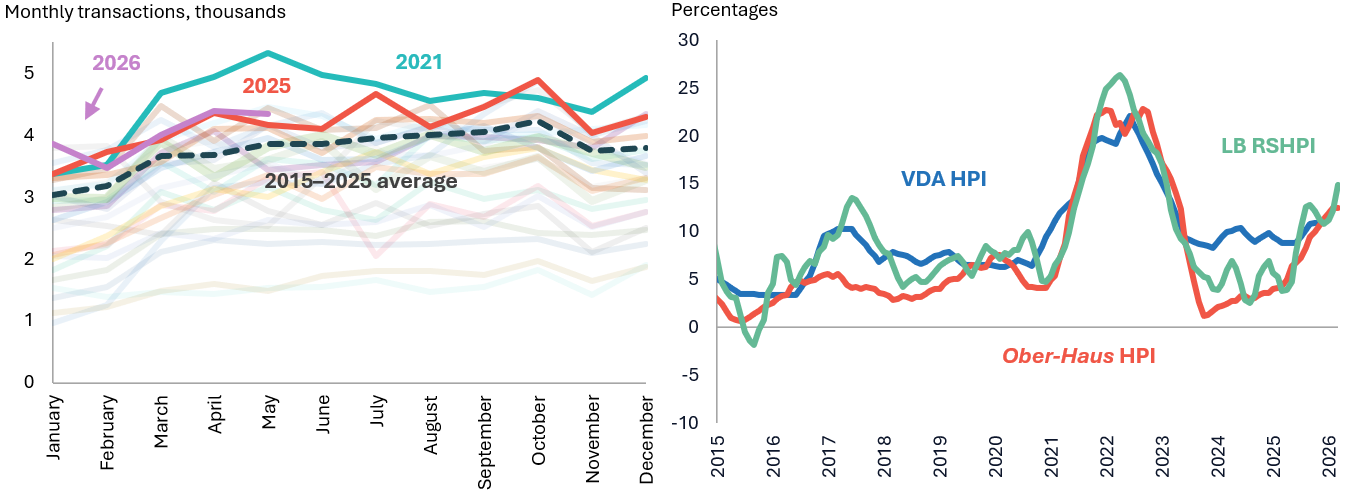
The housing market activity was elevated in 2025 and is not expected to moderate in 2026. The number of housing units sold in 2025 was one-fifth higher than in 2024 and was surpassed only in 2021, when market activity reached a record high (see Chart 12, left-hand panel). Demand remained strong at the start of 2026, with the number of transactions continuing to exceed the long-term trend by 10–15%. Vilnius County stood out for its high volume of transactions: in 2025, market activity in the city was 19% higher and in the surrounding region as much as 24% higher than the trend of the past decade. The growth of housing markets on the outskirts of towns is a feature common to all major Lithuanian cities and reflects a pattern of urban sprawl, whereby urban expansion occurs more in breadth than in density. Demand for housing is not expected to decline in the near future and will continue to be supported by the still relatively favourable level of housing affordability, as well as the withdrawal of funds from the 2nd pension pillar (see Box 2 for more details).
Reflecting strong demand, the annual rate of growth of house prices accelerated and was above 10%.
Chart 12. Monthly number of housing transactions in Lithuania in 2000–2026 (left-hand panel) and annual change in housing sales prices (right-hand panel)
Sources: State Enterprise Centre of Registers, State Data Agency, Ober–Haus and LB RSHPI.
Note: HPI – housing price index; LB RSHPI – repeat sales house price index of Lietuvos bankas.
Prepared by Daumantas Skinkys
Withdrawals from the 2nd pension pillar will stimulate the real estate market, but only about 6% of households with pension savings will be eligible to use these funds to obtain a mortgage.
Chart A. Breakdown of funds accumulated by individuals in the 2nd pension pillar (left-hand panel), annual number of housing transactions and projections by scenario (right-hand panel)
Sources: State Data Agency and State Enterprise Centre of Registers.
Notes: The left-hand panel shows a projection for the fourth quarter of 2025 based on micro dataset on fund participants from the first half of 2023. The calculations use data on pension fund performance and State Data Agency’s data on wages; the x-axis is shortened; the right-hand panel shows calculations based on scenarios A (intensive), B (moderate) and C (mild), assuming that 20, 10 and 5% of households not restricted by the RLR, which will take effect in August 2026, participate in the 2nd pension pillar. The red bars indicate additional demand due to withdrawn funds. Other assumptions: (1) The 2020–2025 average, i.e. 46,000 housing transactions, is used to derive the baseline projection for 2026–2027; (2) it is assumed that households with 1 or 2 adults account for 40% and 60% of the buyer flow respectively; (3) it is assumed that only those households saving in the 2nd pillar with an average age of no more than 45 will purchase housing; (4) assumption is made that the household has no additional savings.
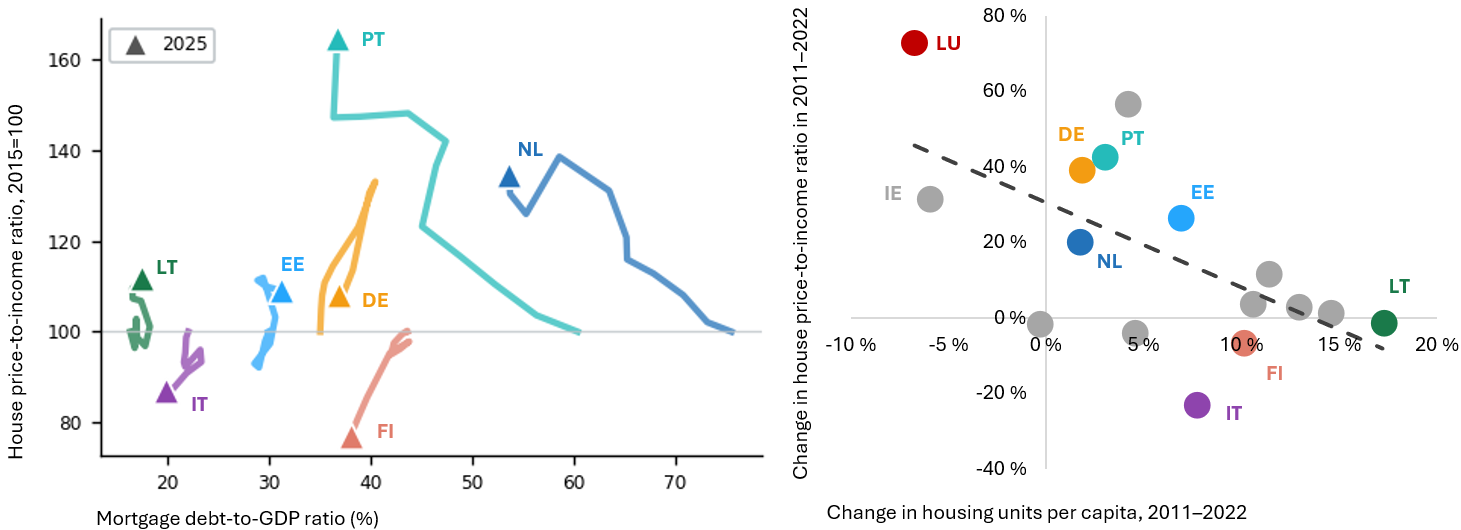
Changes in housing affordability in the euro area were mostly driven by shifts in housing supply rather than changes in credit conditions.
Chart 13. Changes in housing affordability and indebtedness in selected euro area countries (left-hand panel) and changes in housing affordability and supply in euro area countries (right-hand panel)
Sources: OECD and ECB Statistical Data Warehouse.
Notes: Calculations use disposable income; LT – Lithuania, IT – Italy, EE – Estonia, DE – Germany, FI – Finland, PT – Portugal, NL – Netherlands, IE – Ireland, LU – Luxembourg; due to the lack of data, Greece, Cyprus, Croatia and Malta are not included in the right-hand panel.
A higher housing supply is associated with better affordability. In euro area countries where supply grew more rapidly, affordability improved or at least deteriorated to a lesser degree (see Chart 13, right-hand panel). In 2022, Italy, France and Finland stood out in the euro area for their high housing supply (about 0.6 dwellings per capita), while Ireland and Luxembourg stood out for their housing shortages (about 0.4). Given limited supply and a growing population, it was in Ireland and Luxembourg that affordability deteriorated the most between 2011 and 2022. Mainly due to emigration, the number of homes per capita in Lithuania increased from 0.45 to 0.52 between 2011 and 2022, reaching the euro area average. The population of Lithuania began to grow since 2022, but the accumulated supply buffer allowed for the absorption of new demand and ensured relatively stable housing affordability. At the beginning of 2026, housing affordability deteriorated slightly, but its level remained close to the long-term trend: the ratios of housing prices to annual net income across Lithuania and in Vilnius stood at 6 and 7 respectively and remained below the 2015–2025 average (6.5 and 7.5).
Construction of new housing has accelerated, but Vilnius may soon face a shortage of completed housing units.
Chart 14. Housing supply in the primary housing market (left-hand panel) and increase in apartment supply and population in Vilnius (right-hand panel)
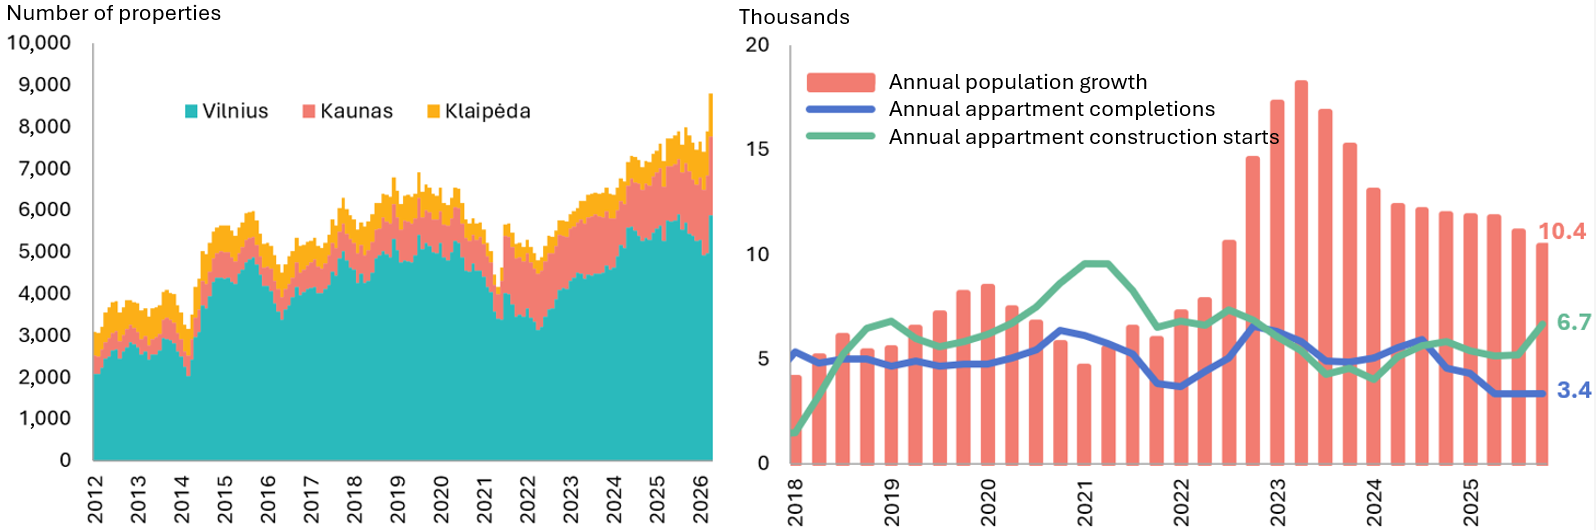
Sources: UAB Inreal, State Data Agency and territorial health insurance funds.
Notes: The left-hand panel shows that about a fifth of the homes offered for sale in Vilnius have already been reserved, while about 40–50% have been reserved in Kaunas and Klaipėda (a total of about 2,000 homes). Both homes under construction and those not yet started are included in active listings.
Banks are exposed to the real estate market both through loans granted for real estate activities and through real estate used as loan collateral.
Chart 15. Share of RE-related loans in the bank portfolio of credit to private non-financial sector (left-hand panel) and share of bank loans to businesses with RE collateral in the EU (right-hand panel)
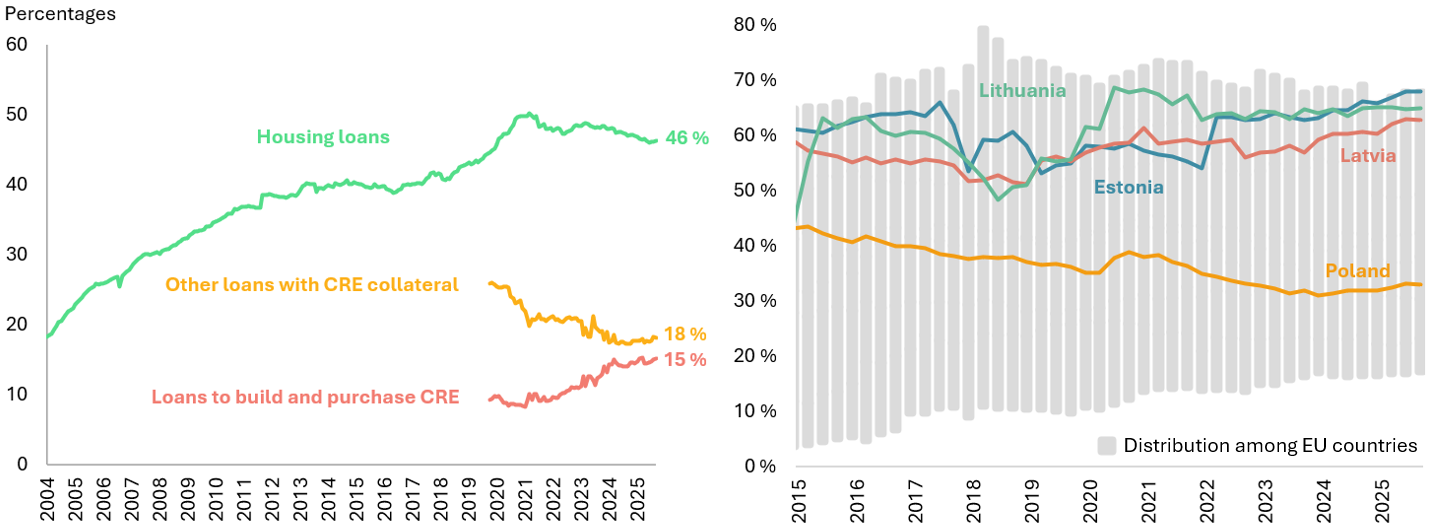
Sources: Lietuvos bankas and State Data Agency.
Notes: The left-hand panel shows the share of loans by type in the total bank portfolio of loans to the private non-financial sector; the right-hand panel shows a sample of EU countries, excluding Bulgaria, Hungary, Ireland and Spain.
Investment in CRE remains subdued, constrained by a lower risk premium. The risk premium for CRE investments remained largely unchanged in 2025 and was nearly 3 percentage points lower than in the period prior to the start of monetary policy tightening (see Chart 16, left-hand panel). As investors turned to more attractive alternatives, the volume of investment transactions in 2025 was close to a decade low. With capital flows shifting away from the office segment, investment in industrial and retail properties increased. In addition, the share of investment attributed to Kaunas increased (accounting for about 30% in 2025, compared with an average of 10% in 2015–2024). Although the volume of investment transactions remains low, cheaper borrowing has provided incentives to carry out lower-value transactions. Including these recent transactions, the market is already quite active, with the number of CRE sales transactions being 30% higher in 2025 than in 2024.
After several shocks, investment in CRE contracted, but a widespread price correction was avoided.
Chart 16. CRE risk premium and investment volume (left-hand panel) and sales prices (right-hand panel)
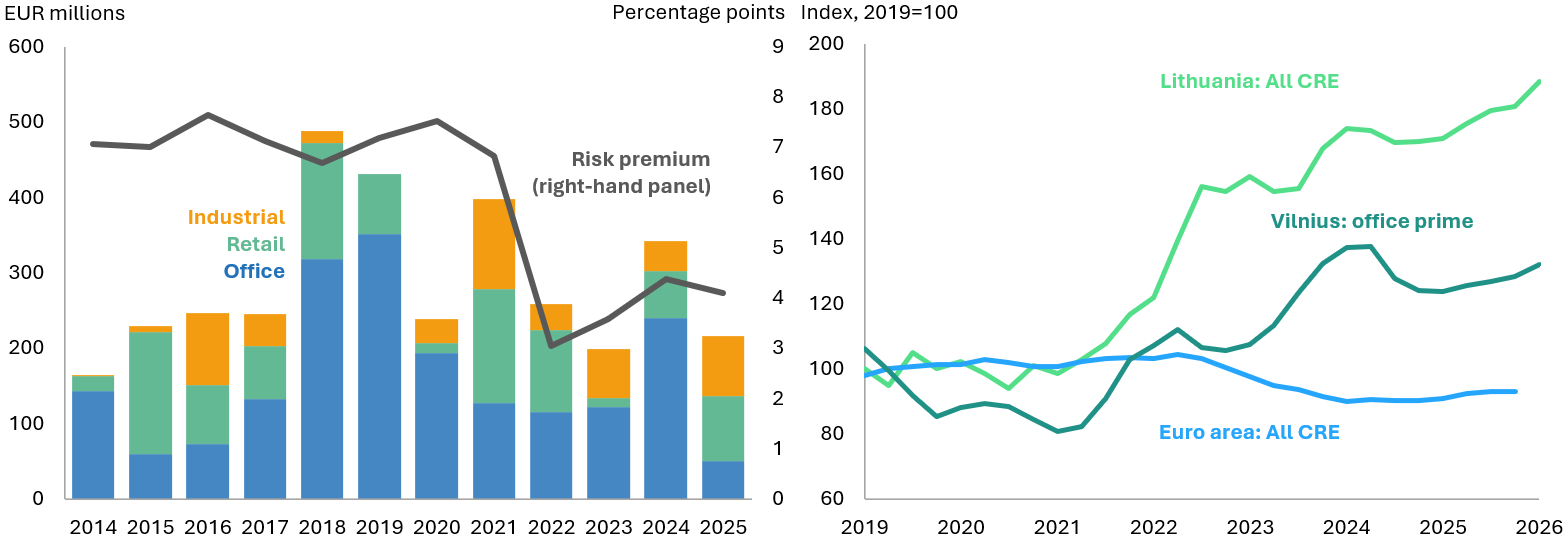
Sources: Refinitiv, CPB Real Estate Services, ECB Data Warehouse, State Enterprise Centre of Registers and Eurostat.
Notes: The industrial segment is defined as CRE for production and logistical purposes. The risk premium is the difference between CRE rental rates and the yield on 10-year Lithuanian government securities in the final quarter of the relevant year.
The vacancy rate for office space in Vilnius remains elevated, but new construction has slowed as developers have adapted to weaker demand. Compared with other CRE, the office segment has stood out for its robust development over the past decade: since 2015, the stock of office space has increased by 200% (retail and industrial space by 30% and 125% respectively). Amid the challenges of hybrid work, demand has not kept pace with new supply. Despite the slowdown in development (see Chart 17, left-hand panel), the vacancy rate for offices in Vilnius remained at 10% at the beginning of 2026, while that for retail and industrial space stood at 1% and 4% respectively. In CRE segments with higher vacancy rates, rental rates have risen more slowly since 2022 (see Chart 17, right-hand panel). This has reduced real estate managers’ revenues and increased downward pressure on prices for these properties. On the other hand, no rent price correction has been observed even in the more vulnerable segments, indicating that property managers are not facing serious difficulties.
Due to oversupply in the Vilnius office segment, the risk of price correction remains elevated.
Chart 17. CRE stock (left-hand panel) and relationship between vacancy and rental rates (right-hand panel)
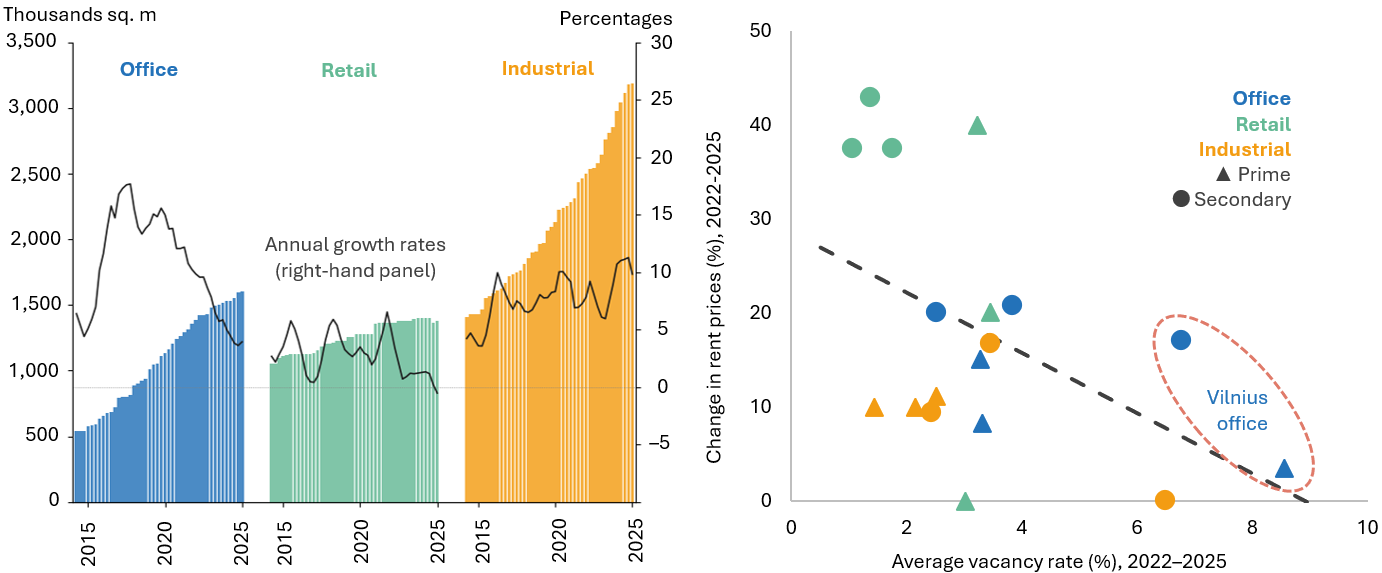
Source: CPB Real Estate Services.
Note: In the left-hand panel, annual growth rates are calculated using a 12-month moving average; in the right-hand panel, data are presented for 18 different CRE segments in Vilnius, Kaunas and Klaipėda.
Risks associated with residential and commercial real estate differ cyclically: the housing market faces an upside risk of excessive price growth due to elevated demand, while the office segment in Vilnius is exposed to the risk of price correction due to oversupply. Activity in the housing market is strong and is expected to continue growing due to funds withdrawn from the second pension pillar. In case of a supply and demand mismatch, price imbalances may grow, and the housing market’s vulnerability to shocks may increase. On the other hand, low household indebtedness and sound finances reduce the likelihood of risks materialising (see Section 1.3 for more details). With the pace of construction and price growth slowing, the level of risk in the CRE segment has remained broadly unchanged over the year, but price imbalances still pose a risk of a Vilnius office price correction. Nevertheless, the situation in other CRE segments is favourable, with no imbalances observed. Furthermore, with banks lending to the safest CRE projects, the quality of the loan portfolio is good. This is also reflected in the historically low level of non-performing loans at banks (less than 1% at the end of 2025).
Bank exposures to higher-risk CRE are not significant and the risk level of real estate fund investment is mitigated by the limited prevalence of open-end funds.
Chart 18. Portfolio of bank loans secured by commercial real estate (left-hand panel) and value of assets managed by real estate funds by fund type (right-hand panel)
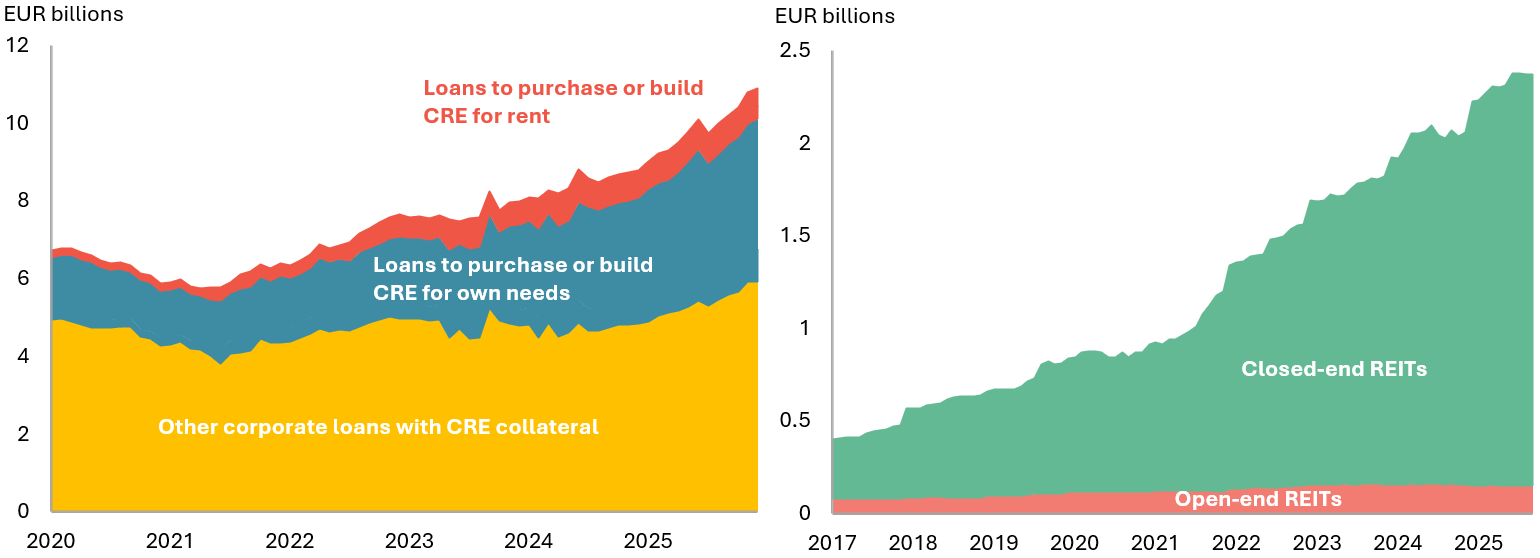
Sources: LRDB and Lietuvos bankas.
1.5.Banking sector developments and resilience
1.5.1.Banking sector developments
Although the profitability of the Lithuanian banking sector declined, it remained high, and the quality of the loan portfolio continued to be sound.
Chart 19. Key items of bank income and expenses for 2024 and 2025, compared to equity (left-hand panel) and shares of loans with significantly increased credit risk and non-performing loans to the private non-financial sector (right-hand panel)
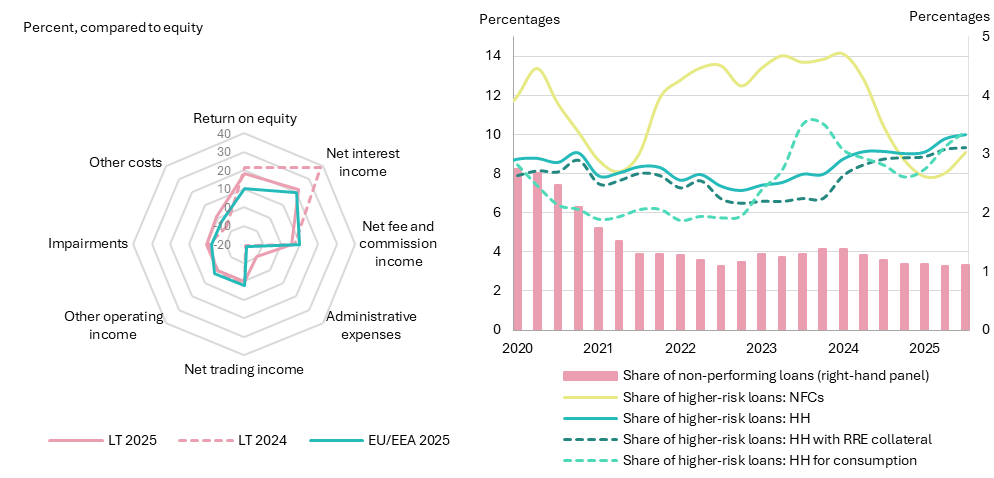
Sources: EBA, Lietuvos bankas and Lietuvos bankas’ calculations.
Notes: Key income and expense items for Lithuanian banks are presented after excluding the Revolut Group; HH – households.
Increased investments in debt securities indicate a slightly higher risk of potential losses due to market corrections. A higher risk exposure is faced by banks with lower liquidity reserves and a larger share of these securities in their portfolios.
Chart 20. Return on assets (left-hand panel) and breakdown of the banking sector’s debt securities portfolio by valuation method, issuer and issuer country (right-hand panel)
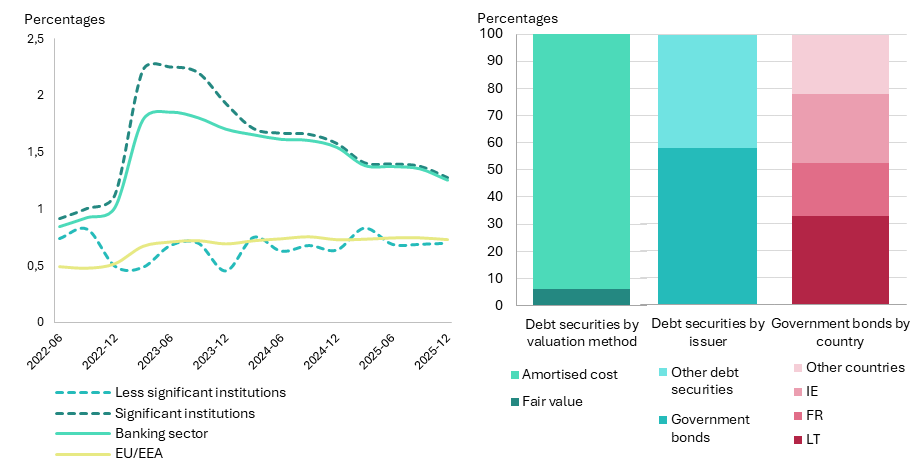
Sources: EBA, Lietuvos bankas and Lietuvos bankas’ calculations.
Note: IE – Ireland, FR – France, LT – Lithuania.
As banks have increased their investment in debt securities, the potential negative impact of a market price correction has grown; however, the likelihood of potential losses is low. Liquid assets and granted loans account for the largest share (83%) of assets. Meanwhile, the share of debt securities held by banks rose by 4.5 percentage points over the year and stood at 15% at the end of 2025, reaching as much as 27% of total assets for some banks. Only a small portion (6%) of the debt securities held by the Lithuanian banking sector is carried at fair value, i.e. revalued at market price (see Chart 20, right-hand panel). Risks could arise if a price correction were to occur and the bank ran short of liquid funds, forcing it to sell its debt securities before maturity, thereby incurring an impairment loss. Expectations of monetary policy tightening and growing risk of public debt sustainability (see Section 1.1 for more details) create the conditions for a potentially more significant correction of debt securities prices in the future. On the other hand, the risk of expected losses is low due to significant reserves of liquid funds, which would reduce the need to sell debt securities prematurely in an adverse situation. It should be noted that banks where debt securities constitute a larger share of assets and accumulated reserves of liquid funds are smaller face greater risk; however, this risk is also mitigated by the high concentration of Lithuanian government securities in these bank portfolios cushioning the potential negative impact of debt sustainability risk.
International and national cooperation is strengthening the financial sector’s resilience against growing cyber risks. With the DORA Regulation entering into effect on 17 January 2025, more stringent operational resilience requirements started to apply. In light of this, Lietuvos bankas assessed whether banks had strengthened their ICT risk management, updated their internal control systems, tightened oversight of ICT service providers and implemented security testing measures. Lietuvos bankas also began conducting cyber resilience stress tests to help assess how financial institutions’ business continuity processes would function in the event of an extreme but likely scenario. Cooperation with the National Cyber Security Centre and various international institutions is also being further strengthened, both through the exchange of relevant information and by coordinating actions in the event of significant cyber incidents. In addition, banks are continuously increasing investments in strengthening the resilience of IT systems and securing the necessary IT experts, all of which contributes to ensuring the resilience of the entire financial system.
The high concentration in the banking credit market is gradually decreasing, while cyber threats remain the main operational risk to the Lithuanian financial system, although the number of significant incidents has declined.
Chart 21. Market concentration based on MFI loan portfolios (left-hand panel) and number of significant cyber incidents faced by FMPs (according to DORA criteria) (right-hand panel)
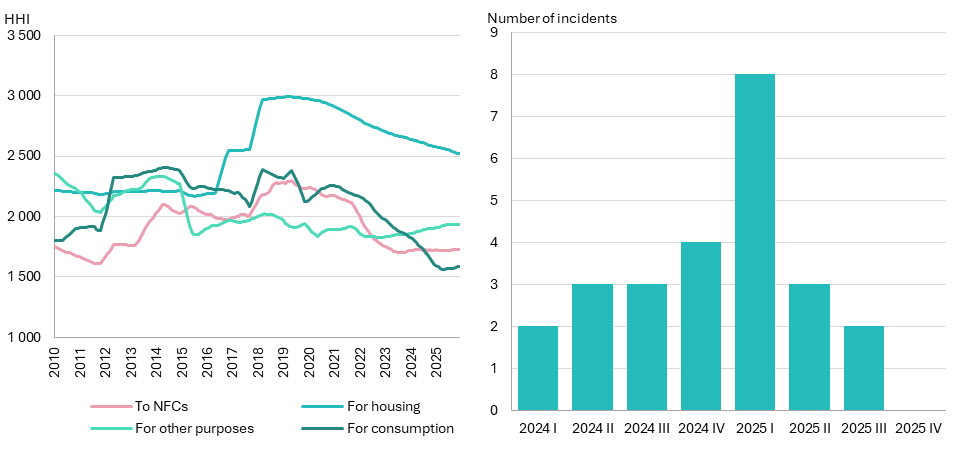
Sources: Lietuvos bankas and Lietuvos bankas’ calculations.
Note: In the left-hand panel, concentration is measured by the Herfindahl-Hirschman Index (HHI).
The Lithuanian banking sector maintains high liquidity and is backed by stable funding sources, which mitigates systemic liquidity risk. In 2025, cash and liquid funds at banks increased by a fifth over the year and accounted for a significant share (42%) of bank assets (excluding the impact of the Revolut Group, these funds decreased by 8% and accounted for 31% of assets). Furthermore, banks operating in Lithuania rely almost exclusively on deposit funding, with deposits accounting for nearly 90% of all liabilities. The majority (56%) of these deposits are attracted on the domestic market (excluding the impact of the Revolut Group, this share would amount to 92%). The deposit structure is dominated by deposits from the private non-financial sector (90%), which is considered one of the most stable sources of funding. It should be noted that banks that rely heavily on deposits from other financial institutions face a higher liquidity risk, as such depositors are more likely to withdraw funds on a larger scale during periods of stress.
The banking sector’s resilience to potential shocks is demonstrated by its strong capitalisation, with top-tier capital instruments continuing to dominate the banking sector. The total capital adequacy ratio (CAR) increased by 1.1 percentage points over the year reaching 23% at the end of 2025. The common equity tier 1 (CET1) ratio decreased slightly to 19.8% (compared to 20.2% a year ago) but remained high. On the other hand, strong capitalisation is mainly supported by larger and long-established banks: the CAR for significant institutions increased from 21.5 to 23.1% over the year, while for other institutions decreased from 20.1 to 19.0%. This indicates that capital strengthening remains important for smaller and newly established banks, particularly in a context of high uncertainty.
1.5.2.Bank solvency assessment
Table 1. Evolution of the key macroeconomic indicators under the stress test scenarios (percentages)
|
Indicator |
Actual indicator |
Baseline scenario |
Adverse scenario |
||||
|
2025 |
2026 |
2027 |
2028 |
2026 |
2027 |
2028 |
|
|
GDP |
2.9 |
3.1 |
2.0 |
2.9 |
-2.3 |
-3.6 |
-0.1 |
|
Exports
of goods and services |
4.2 |
2.0 |
3.1 |
3.4 |
-5.2 |
-9.4 |
-6.2 |
|
Private
consumption expenditure |
1.9 |
3.8 |
0.3 |
4.7 |
-5.5 |
-7.7 |
-3.2 |
|
Unemployment
rate |
6.9 |
6.7 |
6.6 |
6.6 |
8.2 |
10.0 |
10.5 |
|
Compensation
per employee |
10.0 |
9.2 |
6.6 |
6.9 |
1.0 |
-1.3 |
3.0 |
|
Average
annual inflation |
3.4 |
5.1 |
3.0 |
2.5 |
1.7 |
0.4 |
0.2 |
|
Housing
price index |
10.8 |
10.6 |
10.4 |
10.0 |
-10.3 |
-8.7 |
-4.9 |
Sources: State Data Agency and Lietuvos bankas’ calculations.
Note: Data on GDP, exports of goods and services, and private consumption expenditure are at constant prices.
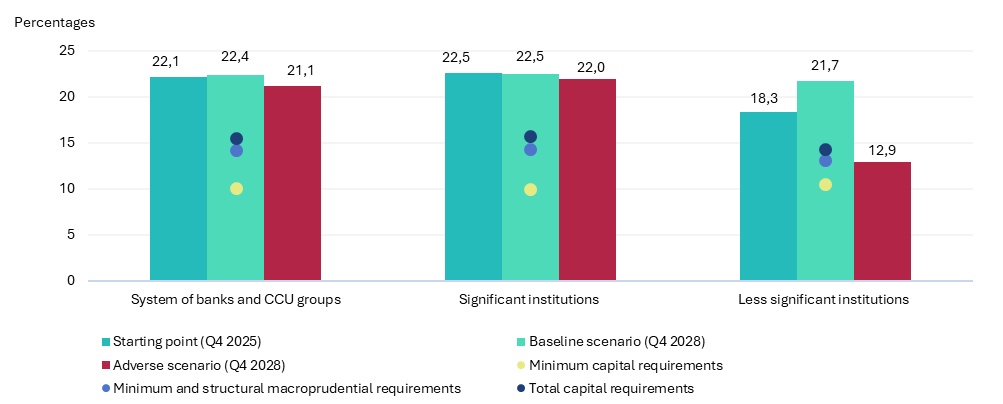
The system of banks and central credit union groups is well capitalised and resilient to potential shocks, but less significant institutions are more vulnerable under the adverse scenario.
Chart 22. Change in total CAR by scenario
Sources: Bank data and Lietuvos bankas’ calculations.
Note: Minimum requirements comprise the 8% minimum capital requirement and the Pillar 2 requirement. The structural macroprudential requirements consist of the capital conservation buffer and the other systemically important institutions buffer. The total capital requirements shown comprises minimum requirements, structural macroprudential requirements, the CCyB and the sectoral SyRB requirements.
Under the adverse scenario, the aggregate CAR of less significant institutions would decline more sharply than that of significant institutions by the end of 2028 but would remain above the minimum capital requirement threshold. Less significant institutions are more sensitive to adverse macroeconomic shocks; their aggregate CAR would fall decline to 12.9% by the end of 2028, while that of significant institutions would decline to 22.0%. Nevertheless, to comply with all capital requirements, the tested institutions would need additional capital of around €65.2 million (about 1.7% of the system’s current capital level). If part of the macroprudential capital buffers were released under the adverse scenario, leaving only minimum and structural requirements in place, the additional capital need would fall to €39.2 million.
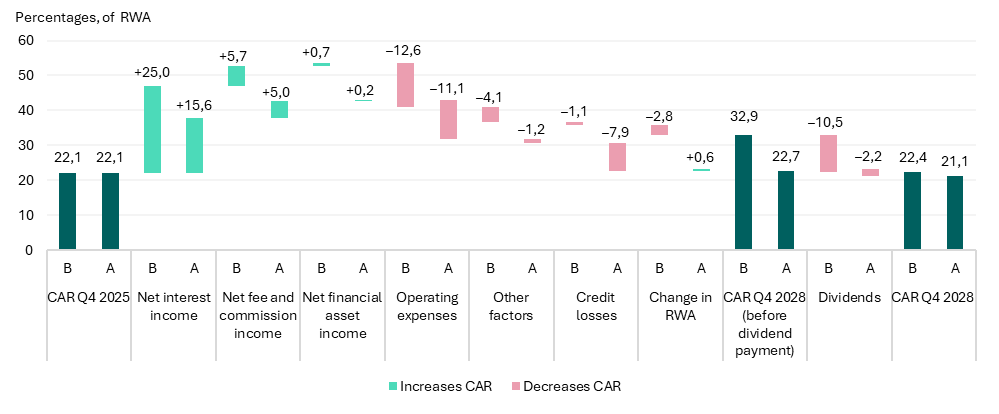
The breakdown of CAR contributions (see Chart 23) indicates that net interest income would allow the banking sector to absorb the increase in credit losses under the adverse scenario. Under the baseline scenario, institutions would continue to expand their loan portfolios over the stress test horizon, while sufficiently high profitability would allow them to further strengthen their already high CAR. Under the adverse scenario, capital growth would be constrained mainly by higher credit losses, which would amount to around €1.4 billion over the entire stress test horizon (around 4.4% of the total loan portfolio at the end of 2025). In the adverse scenario, net interest income would decline but remain sizeable, offsetting credit losses at the financial system level.
Strong net interest income would allow the banking sector to absorb higher credit losses under the adverse scenario, limiting the decline in the CAR.
Chart 23. Breakdown of financial market participants’ CAR under the baseline (B) and adverse (A) scenarios
Sources: Bank data and Lietuvos bankas’ calculations.
Prepared by Ieva Mikaliūnaitė-Jouvanceau
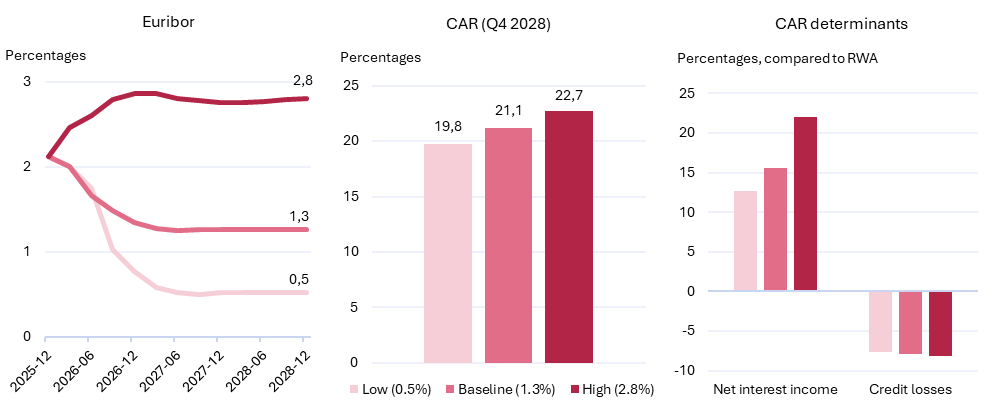
The results show that the banking sector’s CAR remains higher under the high-interest-rate scenario than under the baseline and low-interest-rate scenarios. At the end of the stress test horizon, the banking sector’s CAR would stand at 22.7% under the high-interest-rate scenario, 21.1% under the baseline scenario and 19.8% under the low-interest-rate scenario (see Chart A, central panel). This is mainly driven by higher net interest income. Although credit losses also increase in a higher interest rate environment, their negative impact is offset by stronger growth in interest income, leaving the overall impact on banks’ capital ratios positive (see Chart A, right-hand panel).
In a high-interest rate environment, higher net interest income helps absorb credit losses and supports higher capital ratios.
Chart A. Alternative EURIBOR assumptions (left-hand panel), their impact on the system-wide CAR (central panel) and the main factors behind the change in the CAR (right-hand panel)
Sources: Bank data and Lietuvos bankas’ calculations.
Note: Low, baseline and high refer to testing scenarios in which EURIBOR stands at 0.5%, 1.3% and 2.5%, respectively, at the end of horizon.
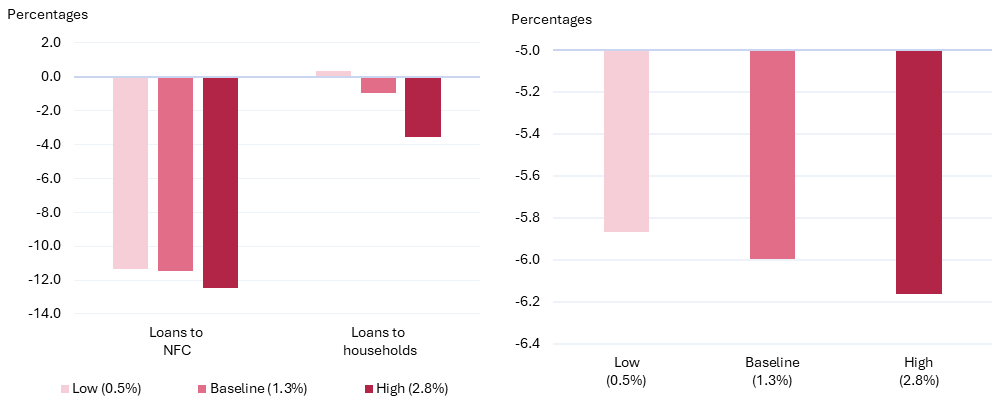
However, higher interest rates lead to a sharper lending contraction. The corporate loan portfolio shrinks under all scenarios due to an unfavourable macroeconomic environment, weaker investment demand and deteriorating business expectations, but this decline is most pronounced in the high-interest-rate scenario. Household lending is even more sensitive to changes in interest rates, as higher borrowing costs directly reduce housing affordability and dampen demand for new loans. As a result, under the high-interest-rate scenario, lending to households also declines at the fastest pace (see Chart B, left-hand panel).
A sharper credit contraction under the high-interest-rate scenario further dampens economic activity. Tighter credit supply constrains household consumption and business investment, while the deteriorating financial position of borrowers further reduces domestic demand. Due to the feedback loop between the banking sector and the real economy, the cumulative decline in real GDP over the three-year horizon under the high-interest-rate scenario is around 0.2 percentage points greater than under the baseline scenario, and 0.1 percentage points lower under the low-interest-rate scenario (see Chart B, right-hand panel). The results show that the sensitivity analysis of interest rate assumptions provides additional information for assessing the interaction between the banking sector’s resilience and macroeconomic developments under stress.
Higher interest rates constrain lending and further dampen economic activity.
Chart B. Impact of alternative interest rate scenarios on the private non-financial sector loan portfolio (left-hand panel) and real GDP (right-hand panel)
Sources: Bank data and Lietuvos bankas’ calculations.
Note: The panels show the change in the loan portfolio for non-financial corporations (NFC) and households over the stress testing horizon (Q4 2025 to Q4 2028), while the real GDP panel shows the cumulative change over 2026–2028.
1.5.3.Bank liquidity assessment
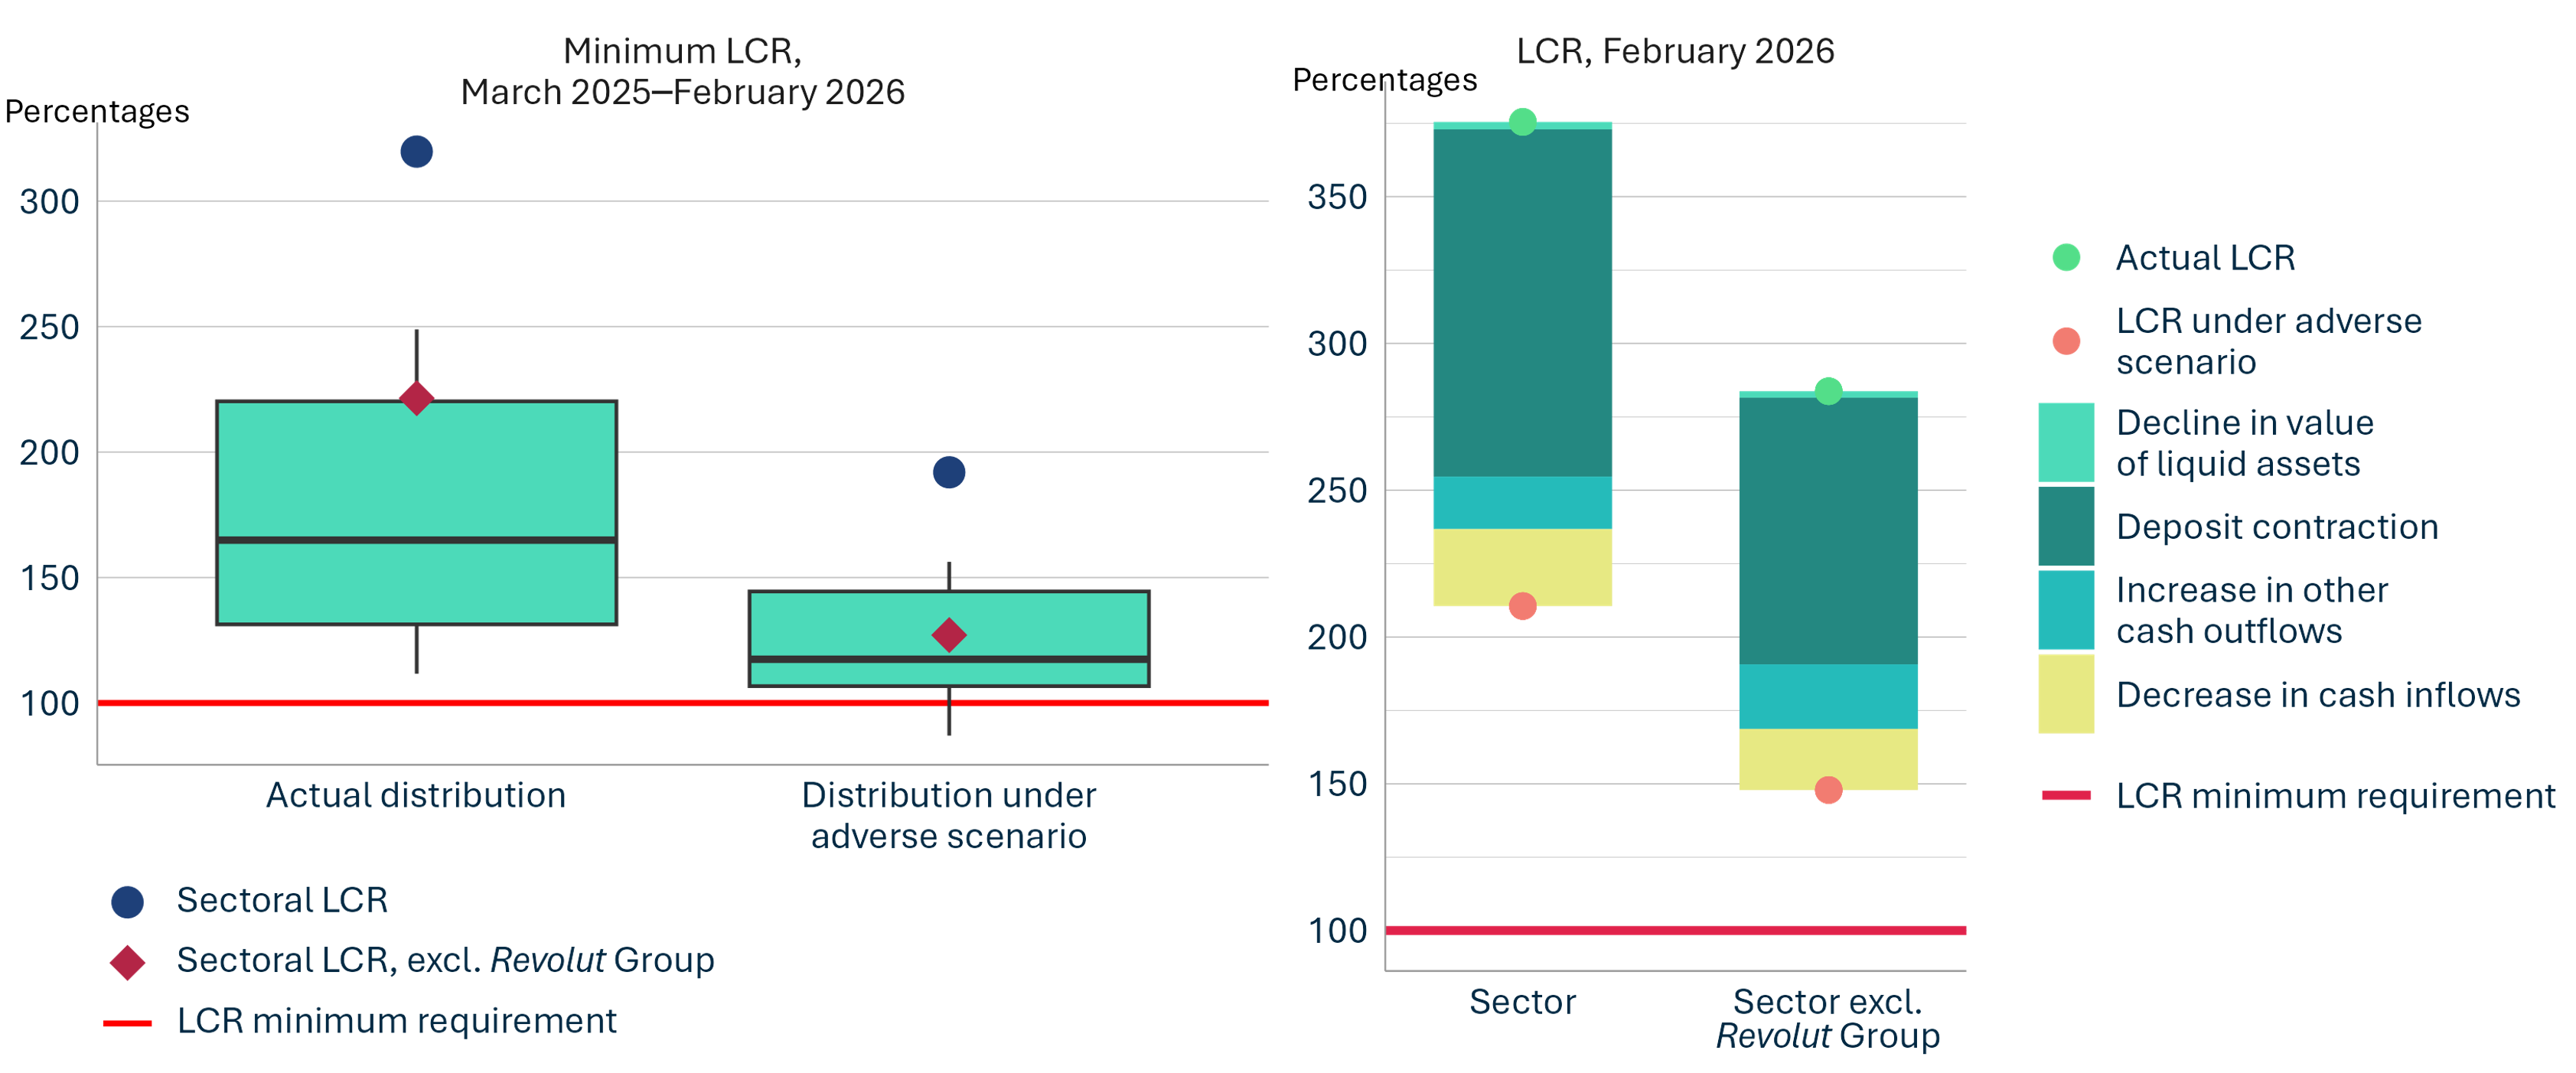
To assess the resilience of credit institutions to potential liquidity shocks, a liquidity stress test was conducted. The test was conducted using monthly data covering a one-year period (from March 2025 to February 2026), assessing the ability of credit institutions to meet a significantly increased 30-day liquidity need for each month within this period, i.e. by performing 12 separate one-month horizon liquidity assessments. This method allows for an assessment of how stable the results are over time and whether the ability of credit institutions to withstand liquidity shocks is sensitive to the choice of time period. This is particularly important because the LCR can vary significantly over the course of a year.
The system of banks and central credit union groups remains resilient to potential liquidity shocks, with most credit institutions able to withstand them with a cushion.
Chart 24. Distribution of the LCR of the system of banks and central credit union groups (left-hand panel) and breakdown of factors contributing to the decline in the LCR under an adverse scenario (right-hand panel)
Source: Bank data and Lietuvos bankas’ calculations.
Note: In the left-hand panel, the distribution of minimum LCR shows the breakdown of the lowest LCR values for individual credit institutions over a one-year period between March 2025 and February 2026; the right-hand panel presents the breakdown of factors contributing to the decline in the LCR based on data as of February 2026.
1.6.Non-bank financial sector trends
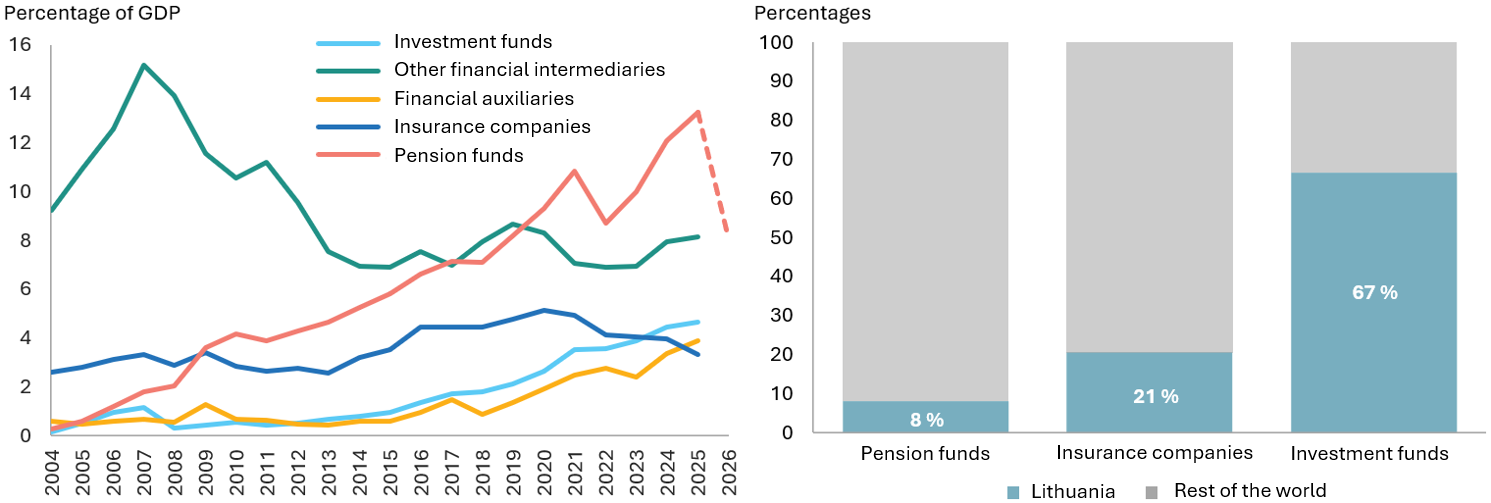
Due to changes in the pension system, the value of assets managed by pension funds fell sharply at the beginning of 2026, but this process does not pose a risk to financial stability.
Chart 25. Ratio of assets of non-bank financial institutions to GDP (left-hand panel) and structure of assets directly managed by institutions by location as of the end of 2025 (right-hand panel)
Source: Lietuvos bankas.
Notes: The dotted line in the left-hand panel represents April 2026 data point. The financial account data used exclude non-financial assets as well as holding companies. Financial auxiliaries include insurance brokers and agents, pension fund and CIU management companies, operators of crowdfunding and peer-to-peer lending platforms, etc. Other financial intermediaries include financial leasing companies, factoring companies, venture capital companies, etc.
When the option to withdraw funds from the 2nd pension pillar became available in early 2026, the value of assets managed by pension funds declined by more than a third. At the end of 2025, assets managed by pension funds amounted to €11.1 billion (or 13.8% of GDP; see Chart 25, left-hand panel). The 2nd and 3rd pension pillars managed 95% and 5% of the sector’s assets respectively, while the number of participants stood at 1.4 million and 0.2 million respectively. Pension funds continue to invest primarily in shares of foreign investment funds (see Chart 25, right-hand panel) and the life-cycle strategy is the main principle guiding asset allocation. In 2025, the sector’s growth was driven by rising contributions and investment returns (approximately 6% per year). However, as withdrawals from the 2nd pillar began, the sector’s assets under management contracted to approximately €7 billion (8% of GDP) in April 2026. Although some of the funds withdrawn from the 2nd pillar may be transferred to the 3rd pillar, the sector is expected to contract overall in 2026–2027. However, this process does not pose a risk to financial stability.
The value of investment fund assets increased by 11% over the year, driven by both investment returns and new inflows. At the end of 2025, investment funds managed a total of more than €4 billion in assets. About half of the assets were held as real estate investments, while the rest consisted mainly of corporate equity instruments. The share of non-real estate investments grew significantly over the five-year period (from 30% of the sector’s assets in 2020). 2025 was marked by a fivefold increase in investment inflows from pension funds (reaching €120 million) indicating that, as the sector matures, institutional investors are becoming more actively involved. Growth was also driven by a large influx of new participants joining the funds: The number of CIU and CIUFII participants increased by 45% and 20% respectively in 2025. Overall, the risks to the financial system arising from the sector are mitigated by the low prevalence of open-end investment funds. Open-end funds have more flexible redemption requirements, so a sudden outflow of investments from them is more likely. However, open-end funds invest primarily in liquid assets (e.g. listed shares), so liquidity risks are managed.
The insurance market in Lithuania continued to grow in 2025, with written premiums increasing by nearly a tenth. The assets of insurers licensed in Lithuania increased by more than 10% (reaching €2.3 billion). The structure of investments managed by insurance companies remained largely unchanged, with government securities accounting for 47%, equities and investment fund units for 37%, and bonds for 10%. The number of non-life insurance policies issued increased by about 5% to nearly 9 million. In the non-life insurance market, the largest share of the premium portfolio was accounted for by motor vehicle insurance (about 51%), property insurance against fire and similar damage (about 24%) and medical expense insurance (16%), which posted the fastest growth in 2025. The life insurance market is dominated by unit-linked life insurance, with premiums under these policies accounting for 81% of all life insurance premiums. All insurance companies licensed in Lithuania were profitable in 2025, with their pre-tax profit totalling €115 million (up by 16%). Nearly 72% of the sector’s profits were generated by non-life insurance companies. All insurance companies met solvency capital requirements as the solvency ratio for the non-life insurance sector was 1.64, while that for life insurance was 1.97. Overall, the insurance sector remains resilient.
The crypto-asset market in Lithuania is shaped by increasingly stricter regulation and consolidation processes. From 2026, only companies with a MiCA licence will be able to provide crypto asset services as unlicensed participants had to cease operations or restructure. Regulation is bringing the crypto-asset sector closer to the traditional financial sector by increasing transparency and ensuring uniform regulation of similar activities, while simultaneously reducing the number of less-prepared companies. Furthermore, the implementation of the MiCA Regulation will significantly contribute to enhancing the resilience of sector institutions and mitigating risks. In early 2026, four companies (Robinhood Europe, Nuvei Liquidity, Coingate, and Micar assets) held a license from Lietuvos bankas authorising them to provide crypto-asset services in Lithuania and other EU Member States. Currently, the crypto-asset sector’s ties with the banking sector remain limited both in Lithuania and across Europe, but market participants are evaluating potential scenarios for strengthening this relationship and seeking measures to ensure that the integration of the sectors proceeds in a controlled manner and does not increase systemic risk.
2.Improving financial stability
2.1. Application of macroprudential measures
The CCyB rate of 1%, applicable since 1 October 2023, remains appropriate and sufficient to address the moderate level of cyclical risk currently observed in both the household and non-financial corporate sectors. The CCyB rate is set based on the level of cyclical risk, which is classified into four stages: low, moderate, medium and high. The level of cyclical risk is determined by assessing a broad range of indicators designed to gauge the level of imbalances in the financial market and the rate of growth of financial cycle indicators. When deciding on the CCyR rate, the situation of individual sectors is taken into account; if the level of cyclical risk in individual economic sectors (e.g. non-financial corporations or households) differs, the overall level of cyclical risk is considered to be the level reached by all sectors. When setting the CCyR, greater weight is given to the situation in the sector with the lower level of risk to ensure that the requirement does not have an unduly adverse impact on access to credit. The assessment of the financial cycle for the first quarter of 2026 shows that, although rapid growth is observed in both the household and corporate sectors, moderate imbalances emerged only in the housing sector due to faster-rising housing prices. The analysis of imbalances and growth indicators of individual sectors shows that the level of cyclical risk in the corporate sector is moderate and high in the household sector. This means that the overall level of cyclical risk reached by both sectors is assessed as moderate, and, in accordance with the principles governing the application of the CCyB in Lithuania, a 1% CCyB rate is applied to address this level of risk. However, the overall level of cyclical risk is continuously monitored and an increase in the CCyB rate would be considered should signs of it growing be observed.
The macroprudential capital buffers increase the resilience of banks to unforeseen shocks.
Chart 26. Macroprudential capital buffers in Lithuania
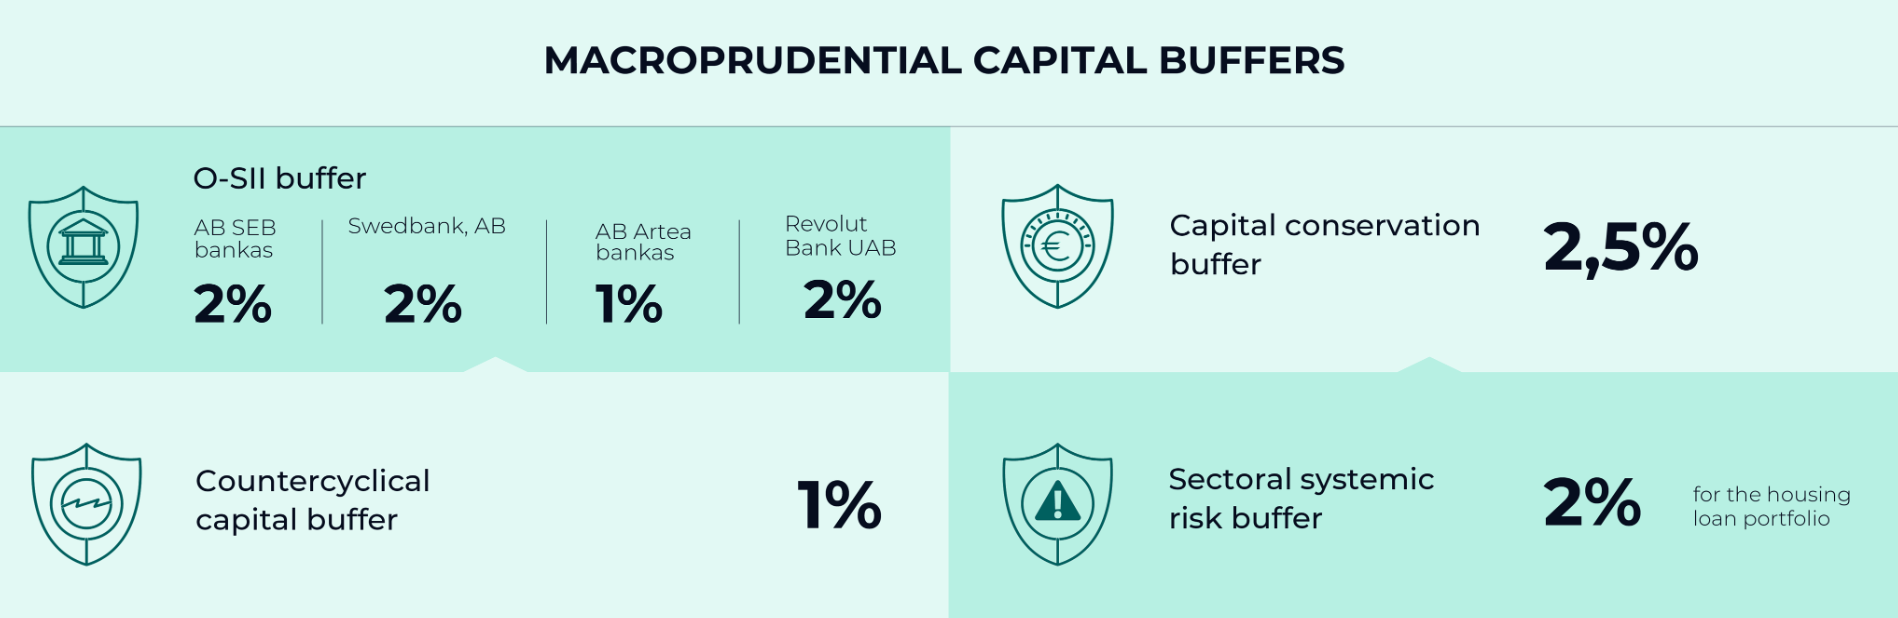
The recent rapid growth in housing market activity and consumer loan portfolio as well as the potential additional stimulatory impact of regulatory changes are being closely monitored and may be addressed, if necessary, by adjusting the SRB requirement. In 2025, the gap between housing prices and fundamental values widened by 3 percentage points reaching 7% by the end of 2025. The annual growth of the housing loan portfolio reached its highest level since 2009. The portfolio of consumer loans to Lithuanian residents is also growing significantly, with the annual growth of this portfolio reaching around 18% in March 2026. Activity in the housing market may be affected by the observed active withdrawal of funds from the 2nd pension pillar and changes to the RLR. The former is likely to affect demand for consumer credit and may also impact the overall size of the household loan portfolio as some residents are likely to choose to use the funds they have withdrawn to pay off existing obligations. The impact of these changes is currently difficult to quantify and will become apparent over the next few quarters, but it will be fully assessed during the regular review of the sectoral SRB in the second half of the year. An increase in the sectoral SRB rate would be considered if the review were to find that the level of systemic risk in the housing market has increased significantly and the current sectoral SRB rate is insufficient to address it.
Borrower-based measures protect consumers from an excessive burden of financial obligations and the amendments to these measures, which will take effect on 1 August 2026, will ensure a more balanced impact on different groups of borrowers in an environment of fluctuating interest rates.
Chart 27. Currently applicable borrower-based measures and their amendments which will take effect on 1 August 2026.
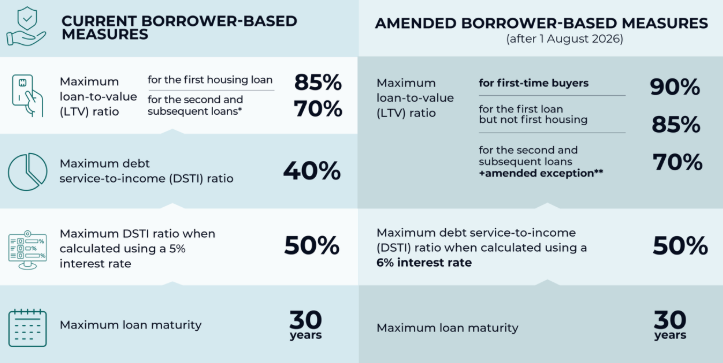
* Exception: The LTV may be greater than 70% (but less than 85%) where the outstanding balance of the previous housing loan(s) is less than half the value of the mortgaged real estate.
** Exception: The LTV may be greater than 70% (but less than 85%) where the outstanding balance of the previous housing loan(s) is less than half of the amount borrowed, i.e. more than half of the loan has already been repaid.
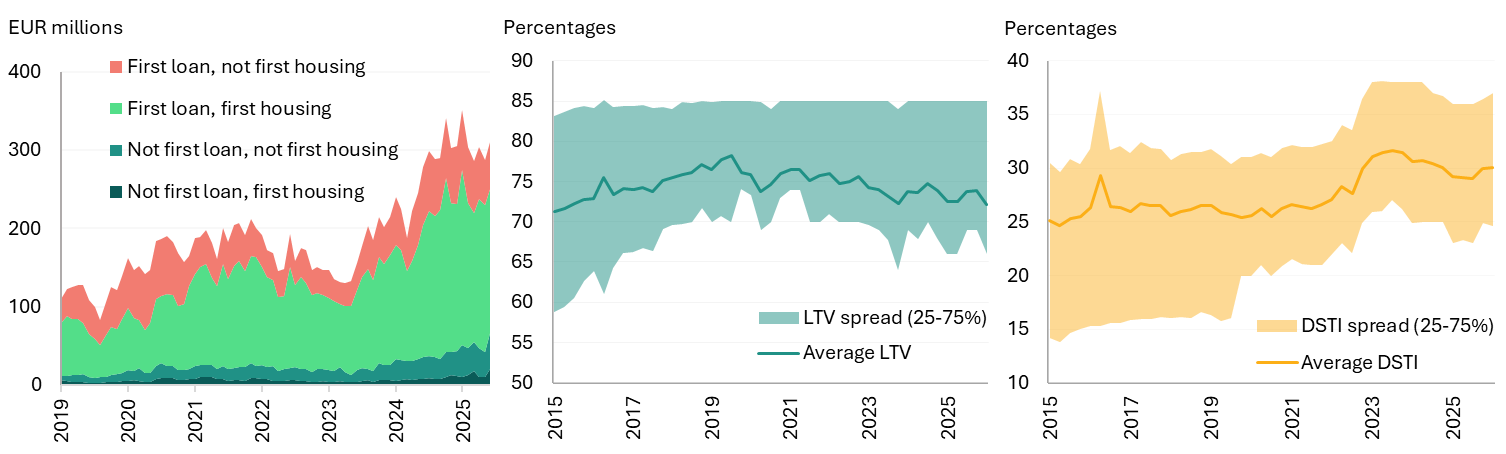
Notably, since the beginning of 2025, the flow of second and subsequent housing loans has grown at a faster pace; however, following the entry into force of the amendments to the RLR, their share in the flow of new housing loans is likely to return to its long-term average. In 2025, the annual growth of the flow of new second housing loans reached around 70% (see Chart 28, left-hand panel), while these loans accounted for about 17% of the total flow of new housing loans in January–March 2026, up about 3 percentage points from the average share of total flow of 2025. The RLR amendments will tighten the exception applicable to second or subsequent loans, which allows borrowers to obtain a loan with a higher LTV; therefore, it is likely that some borrowers rushed to take out a second or subsequent loan before the amendments took effect.
In the second half of 2025, an increase in the average LTV and DSTI values for new housing loans was observed, and the flow of second and subsequent housing loans grew at a faster pace following the announcement of the upcoming RLR amendments.
Chart 28. Loan flow by number of outstanding loans and housing (left-hand panel), LTV (central panel) and DSTI (right-hand panel) of new housing loans
Source: LRDB.
In the second half of 2025, an increase in the average LTV and DSTI values for new housing loans was observed, driven largely by a larger share of higher-value first housing loans. However, in the first quarter of 2026, LTV values began to decline again and approach the levels seen prior to the most recent cycle of interest rate hikes, while the DSTI remained elevated due to the higher EURIBOR (see Chart 28, central and right-hand panels). If, due to the protracted conflict in the Middle East, housing loan interest rates for consumers remain at higher levels for some time, the average DSTI may remain elevated for a longer period; however, the RLR amendments taking effect in August 2026 will ensure a more even impact of the measures throughout the interest rate cycle, and in a higher interest rate environment, the DSTI limit set by the RLR will place fewer constraints on borrowers.
2.2. Other measures proposed by Lietuvos bankas for the financial sector
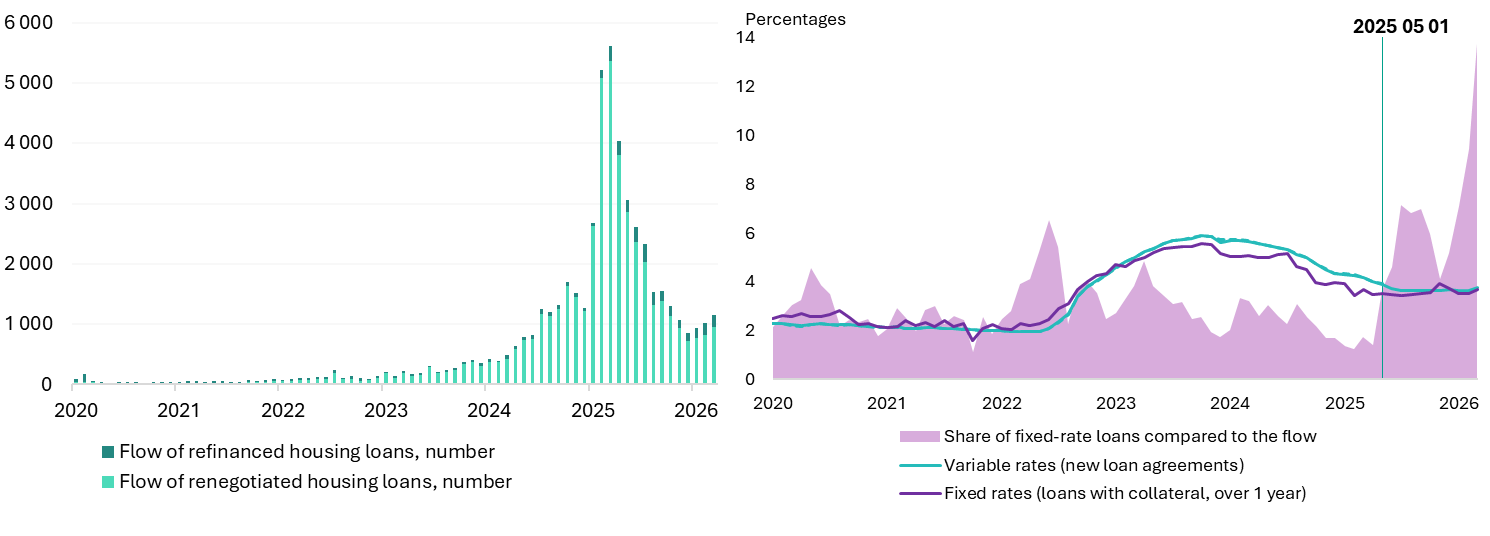
More than a year after the amendments to the Republic of Lithuania Law on Real Estate Related Credit took effect, the volume of refinancing and loan renegotiation has more than doubled, indicating a significant increase in market activity. According to the latest data for March 2026, more than 2,700 loans have been refinanced since February 2025 for a total value exceeding €275 million, which accounts for nearly 2% of the total housing loan portfolio. In addition, more than 30,000 loans for a total value of around €2.7 billion have been renegotiated since February 2025, accounting for 19% of the total housing loan portfolio. This upward trend has been observed since the beginning of 2024, when the amendments to the refinancing procedure were initiated. Since then, 27% of the total housing loan portfolio has been renegotiated. Refinancing and renegotiation volumes in the first quarter of 2026 remain stable; in both cases, the levels are still significantly higher than they were before the legislative changes in 2022–2023 (see Chart 29, left-hand panel).
By refinancing their loans and renegotiating loan terms with their existing lenders, consumers significantly improved their housing loan terms. Since February 2025, consumers who refinanced their loans significantly reduced their margins (by an average of 0.42 percentage points) and will be able to save up to €7,000 on average over the entire loan period. Consumers also renegotiated their loan terms and reduced their margins by 0.33 percentage points on average, which will allow them to save up to €4,000 on average over the entire loan period. In total, more than 45,000 consumers already took advantage of loan refinancing or renegotiation on more favourable terms between 2024 and February 2026, which will save them a total of over €250 million over the entire loan period.
Consumers are actively taking advantage of the opportunities offered by the simplified refinancing procedure, and the share of fixed-rate loans has increased significantly compared to the total flow of new housing loans.
Chart 29. Monthly flow of refinanced housing loans and renegotiations (left-hand panel) and share of fixed-rate loans relative to the flow (right-hand panel)
Sources: PRDB and MFIs.
Refinancing trends indicate that borrowers’ decisions to refinance their existing loans are primarily based on economic benefits. First, the term of refinanced loans is usually longer, and the more time remaining until the loan is fully repaid, the greater the benefit to the borrower due to the lower interest rate, making refinancing most attractive for such borrowers. Second, since more than half of refinanced loans are granted with an LTV of less than 60%, it is likely that households with lower LTV ratios, whom lenders consider less risky, are more actively taking advantage of refinancing opportunities. These households can expect more favourable terms and more competitive offers from other banks.
Following the entry into force on 1 May 2025 of the requirement for banks to offer housing loans with both variable interest rates and fixed interest rates for a period of at least five years, the share of the latter has increased significantly relative to the total flow of new housing loans. This requirement applies to banks most active in the housing loan segment, whose housing loan portfolios exceed €50 million. Between January and April 2025, the share of fixed-rate housing loans averaged 1.5%, while it was 10.1% on average in the first quarter of 2026 (see Chart 29, right-hand panel). It is precisely the banks subject to this requirement that have contributed most significantly to the growth of the share of fixed-rate loans, which shows that the regulatory changes are effective as they ensure that consumers have real choices and promote competition among lenders.
Abbreviations
AB public limited liability company
CCyB counter-cyclical capital buffer
RLR Responsible Lending Regulations
GDP gross domestic product
DSTI ratio Debt service-to-income ratio
EBA European Banking Authority
ECB European Central Bank
ESCB European System of Central Banks
EEA European Economic Area
EC European Commission
EMI electronic money institution
ES European Union
Fintech financial technology
FMP financial market participant
CIUFII collective investment undertakings for informed investors
ICT Information and Communication Technologies
IT information technology
USA United States of America
CIU collective investment undertaking
CAR capital adequacy ratio
LCR liquidity coverage ratio
LSTI ratio loan service-to-income ratio
LTV loan-to-value ratio
LSEG London Stock Exchange Group
MiCA Regulation Regulation on markets in crypto-assets
PI payment institution
RE real estate
MFI monetary financial institution
LRD Loan Risk Database
SRB systemic risk buffer
HICP Harmonised Index of Consumer Prices
SME small- and medium-sized enterprise
IMF International Monetary Fund
UAB private limited liability company
SDA State Data Agency
Securities securities
GS government securities
|
© Lietuvos bankas Gedimino pr. 6, LT-01103 Vilnius The Financial Stability Review looks at the developments in the banking sector, companies and households and the situation in RE markets, identifies the key risks and challenges that could affect the operation of Lithuania’s financial system, especially banks, and the financial system’s ability to withstand shocks. The material presented in this review is the result of statistical data analysis, modelling and expert assessment. The review is prepared by Lietuvos bankas. The cut-off date for the data used in the publication is 1 May. Reproduction for educational and non-commercial purposes is permitted provided that the source is acknowledged. ISSN 1822-5241 (online) |