
2021-03-30

Review of the Balance of Payments services exports and imports for Q4 2020 (Joint release by the Bank of Lithuania and Statistics Lithuania)
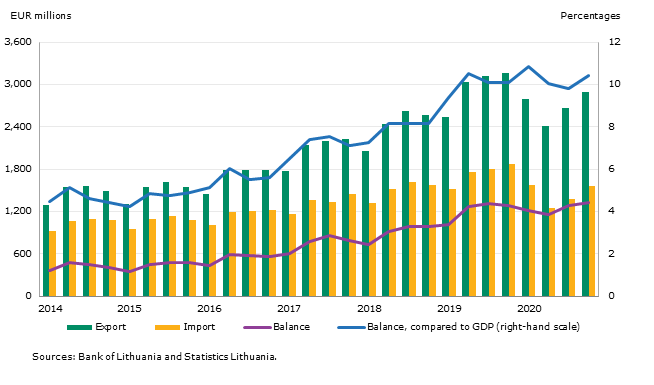
The Bank of Lithuania and Statistics Lithuania report that exports of services amounted to €2.9 billion in Q4 2020, decreasing year on year by 8.4%, whereas imports of services stood at €1.6 billion, declining by 16.5% year on year.
The surplus in the balance of services (€1.3 billion or 10.4% of GDP) rose by 3.3% year on year (see Chart 1).
In Q4 2020, the largest year-on-year fall was registered in exports of travel services (77.5%) and their imports (78.0%) (see Table).
Transport services comprised the largest share of export and import of services (64.2% and 56.5% respectively). In Q4 2020, the largest surplus (€745.4 million) was recorded on the balance of road transport services, while the largest deficit (€17.3 million) – on the balance of sea transport services.
Exports of services to the European Union (EU) Member States (27) accounted for 69.9% of total exports of services, a year-on-year drop of 3.9%. Imports of services from the EU Member States accounted for 61.3% of total imports of services, contracting year on year by 16.5%.
Germany was Lithuania’s main partner in exports of services in Q4 2020. The volume of exports to this country decreased by 1.6% year on year (see Chart 2). Transport (80.3%) and other business (6.5%) services comprised the largest share of total exports of services to Germany.
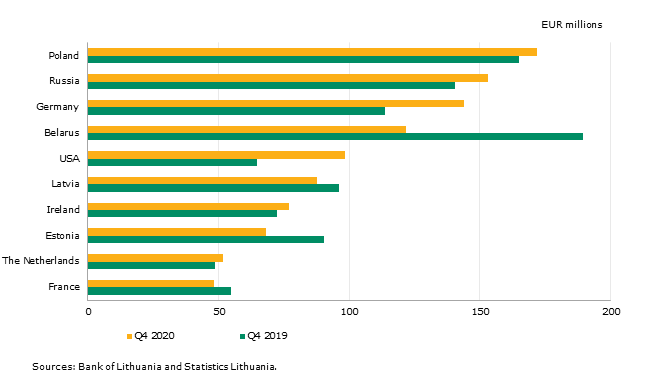
In the period under review, Lithuania’s main partner in imports of services was Poland (see Chart 3). The volume of imports from this country increased by 4.2% year on year. The largest share of total imports of services from Poland consisted of transport and other business services (85.0% and 7.1% respectively).
Chart 1. Balance of services
Exports and imports of services in Q4 2020: composition and annual change
|
Export |
Import |
|||||
|
EUR millions |
Share,% |
Annual change, % |
EUR millions |
Share,% |
Annual change, % |
|
|
Total services |
2,896.0 |
100.0 |
-8.4 |
1,561.6 |
100.0 |
-16.5 |
|
Technical maintenance and repair services |
58.5 |
2.0 |
-37.1 |
49.0 |
3.1 |
-12.1 |
|
Transport services |
1,859.4 |
64.2 |
-0.7 |
881.5 |
56.5 |
-0.4 |
|
Carriage of passengers |
17.2 |
0.6 |
-63.0 |
4.7 |
0.3 |
-90.1 |
|
Freight |
1,183.8 |
40.9 |
3.8 |
489.8 |
31.4 |
4.2 |
|
Other transport services |
658.4 |
22.7 |
-4.0 |
387.0 |
24.8 |
5.2 |
|
Travel |
60.0 |
2.1 |
-77.5 |
58.1 |
3.7 |
-78.0 |
|
Construction |
108.6 |
3.7 |
-7.6 |
16.0 |
1.0 |
-31.5 |
|
Financial services |
51.0 |
1.8 |
-8.2 |
25.2 |
1.6 |
-28.6 |
|
Telecommunications, computer and information services |
260.8 |
9.0 |
28.7 |
130.3 |
8.4 |
-4.7 |
|
Telecommunications services |
19.3 |
0.7 |
-18.6 |
20.7 |
1.3 |
-20.7 |
|
Computer services |
232.5 |
8.0 |
35.4 |
99.2 |
6.4 |
-1.2 |
|
Information services |
9.0 |
0.3 |
22.8 |
10.4 |
0.7 |
1.6 |
|
Other business services |
388.4 |
13.4 |
-1.8 |
333.3 |
21.3 |
-15.7 |
|
Research and technological development services |
19.4 |
0.7 |
1.7 |
5.4 |
0.3 |
60.7 |
|
Professional and advisory management services |
123.3 |
4.2 |
20.3 |
110.0 |
7.0 |
37.1 |
|
Technical, trade-related and other business services |
245.7 |
8.5 |
-10.4 |
217.9 |
14.0 |
-30.1 |
|
Other undistributed services |
109.3 |
3.8 |
-30.7 |
68.2 |
4.4 |
-9.4 |
Sources: Bank of Lithuania and Statistics Lithuania.
Chart 2. Key partners in exports of services
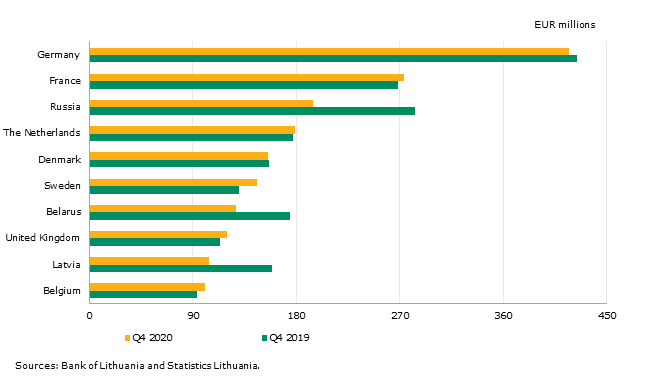
Chart 3. Key partners in imports of services
Detailed data on exports and imports of services is available on the Bank of Lithuania website (External statistics).
Use the My Data Sets tool to create your own data sets, which are saved in your account and automatically updated as soon as they are published.
Download in PDF (109.5 KB download icon)