
2020-06-30

Review of the Balance of Payments services exports and imports for Q1 2020 (Joint release by the Bank of Lithuania and Statistics Lithuania)
Today the Bank of Lithuania and Statistics Lithuania published data on exports and imports of services for Q1 2020, broken down by country and type of service.
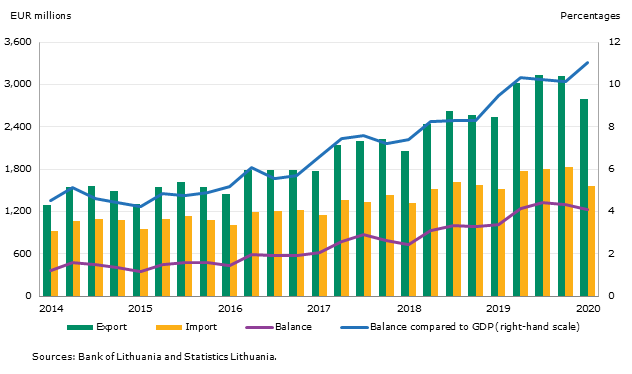
It shows that in Q1 2020 exports of services amounted to €2.8 billion, a year-on-year increase of 9.9%, while imports of services stood at €1.6 billion, a year-on-year increase of 2.5%. The surplus on the balance of services amounted to €1.2 billion, or 11.0% of GDP – an annual increase of 20.9% (see Chart 1).
On a year on year basis, the highest increases were recorded in exports of telecommunications, computer and information services (52.9%) as well as imports of other business services (38.2%) (see the table below).
Transport services comprised the main bulk of export and import of services (60.8% and 50.5% respectively). In Q1 2020, the largest surplus (€703.4 million) was recorded on the balance of road transport services, while the largest deficit (€39.5 million) – on the balance of sea transport services.
Exports of services to the EU Member States (28 countries) accounted for 71.7% of total exports of services, a year-on-year increase of 12.7%. Imports of services from the EU Member States accounted for 64.8% of total imports of services, a year-on-year increase of 3.0%.
Germany was Lithuania’s major partner in exports of services in Q1 2020. The volume of exports to this country increased by 20.8% over the year (see Chart 2). Transport (75.4%) and other business (6.3%) services comprised the largest share of total exports of services to Germany.
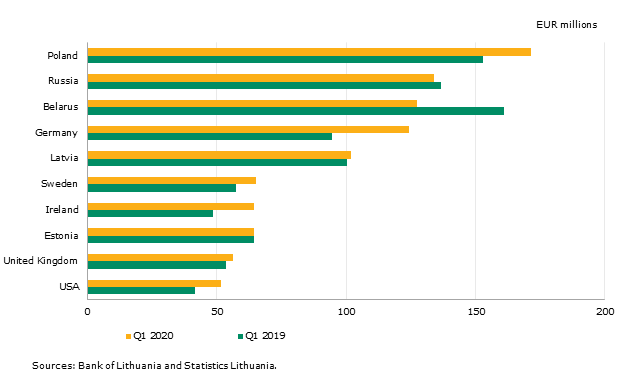
In the period under review, Lithuania’s main partner in imports of services was Poland (see Chart 3). The volume of imports from this country increased by 12.2% over the year. The largest share of total imports of services from Poland consisted of transport and travel services (69.5% and 17.6% respectively).
Chart 1. Balance of services
Exports and imports of services in Q1 2020: composition and annual change
|
Export |
Import |
|||||
|
EUR millions |
Share,% |
Annual change, % |
EUR millions |
Share,% |
Annual change, % |
|
|
Total services |
2,788.6 |
100.0 |
9.9 |
1,558.8 |
100.0 |
2.5 |
|
Technical maintenance and repair services |
95.2 |
3.4 |
23.6 |
46.0 |
3.0 |
8.0 |
|
Transport services |
1,696.9 |
60.8 |
8.5 |
787.4 |
50.5 |
-1.5 |
|
Carriage of passengers |
30.4 |
1.1 |
80.8 |
30.0 |
1.9 |
-8.5 |
|
Freight |
1,070.5 |
38.4 |
13.8 |
429.2 |
27.5 |
5.4 |
|
Other transport services |
596.0 |
21.3 |
-1.7 |
328.2 |
21.1 |
-8.7 |
|
Travel |
202.9 |
7.3 |
-23.7 |
201.7 |
12.9 |
-20.7 |
|
Construction |
100.6 |
3.6 |
43.5 |
21.4 |
1.4 |
-6.5 |
|
Financial services |
44.6 |
1.6 |
32.3 |
22.4 |
1.4 |
-41.9 |
|
Telecommunications, computer and information services |
225.5 |
8.1 |
52.9 |
112.4 |
7.2 |
34.3 |
|
Telecommunications services |
20.1 |
0.7 |
7.8 |
21.5 |
1.4 |
-6.2 |
|
Computer services |
198.1 |
7.1 |
60.3 |
82.8 |
5.3 |
48.8 |
|
Information services |
7.3 |
0.3 |
38.5 |
8.1 |
0.5 |
56.9 |
|
Other business services |
301.3 |
10.8 |
16.9 |
306.0 |
19.6 |
38.2 |
|
Research and technological development services |
15.2 |
0.5 |
47.4 |
2.4 |
0.2 |
19.1 |
|
Professional and advisory management services |
85.2 |
3.1 |
16.1 |
81.8 |
5.2 |
42.8 |
|
Technical, trade-related and other business services |
200.9 |
7.2 |
15.4 |
221.8 |
14.2 |
36.9 |
|
Other undistributed services |
121.6 |
4.4 |
-0.6 |
61.5 |
4.0 |
5.8 |
Sources: Bank of Lithuania and Statistics Lithuania.
Chart 2. Key partners in exports of services
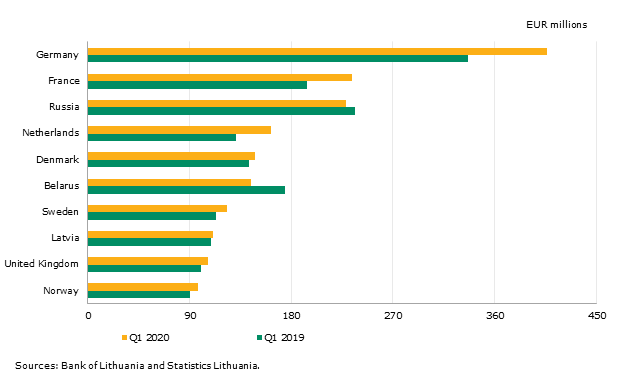
Chart 3. Key partners in imports of services
Detailed data on exports and imports of services is available on the Bank of Lithuania website (External statistics).
Download in PDF (109.6 KB download icon)